Unlock a world of possibilities! Login now and discover the exclusive benefits awaiting you.
- Qlik Community
- :
- All Forums
- :
- QlikView App Dev
- :
- Line chart range
- Subscribe to RSS Feed
- Mark Topic as New
- Mark Topic as Read
- Float this Topic for Current User
- Bookmark
- Subscribe
- Mute
- Printer Friendly Page
- Mark as New
- Bookmark
- Subscribe
- Mute
- Subscribe to RSS Feed
- Permalink
- Report Inappropriate Content
Line chart range
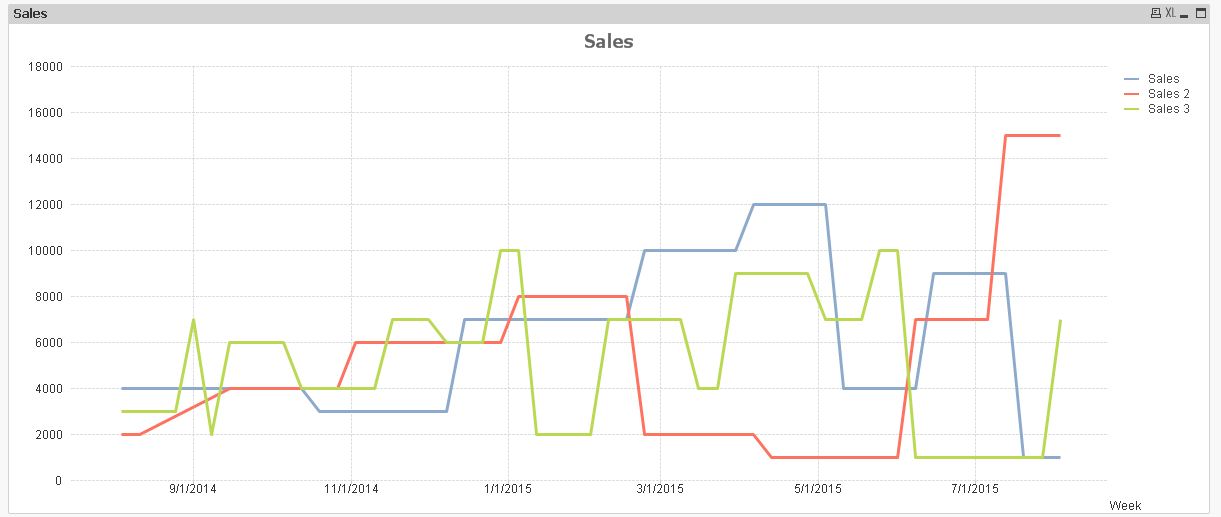
Here is an example line chart that has dates for a whole year.
I don't want the graph to show all the dates because it makes the graph look messy. I want the entire data in the graph but I don't want it to show all the dates, so instead I would like to show a date range, maybe first available date of everything month or two dates of a particular month .. see 'example of line chart date range' jpeg
Any ideas would be greatly appreciated
- Tags:
- app
- development
- Mark as New
- Bookmark
- Subscribe
- Mute
- Subscribe to RSS Feed
- Permalink
- Report Inappropriate Content
Hi,
you can define how many values will be displayed in your chart. Go to properties > Presentation > check the option "Enable the X-axis scrollbar" > then type the number of dates you want to visualize at once.
Just to mention, it used to be a bug where this option didn't work if you typed a 10 in this option. However, I think it has been solved, but just take this in mind,
regards
- Mark as New
- Bookmark
- Subscribe
- Mute
- Subscribe to RSS Feed
- Permalink
- Report Inappropriate Content
Hi,
try with continuous dimension axis:
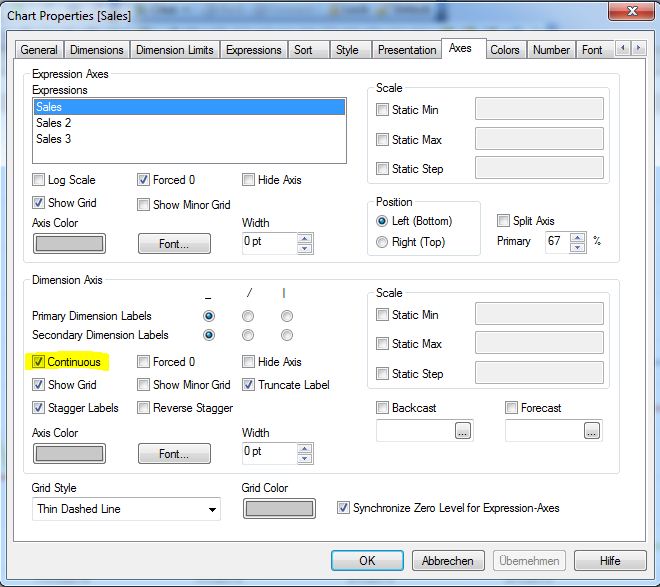
hope this helps
regards
Marco
- Mark as New
- Bookmark
- Subscribe
- Mute
- Subscribe to RSS Feed
- Permalink
- Report Inappropriate Content
Jaime - thanks for the feedback but unfortunately, I do not want a scroll bar at all. I want to be able to see all the data but I don't want to see ALL the dates on the graph, just one or two dates per month.
Marco - this seems to work ok but when I select all the weeks, it only shows the 1 date for every two months. Is there any way we can select the amount of dates we want to see in one month?
In the picture that you attached, I would like to see 9/1/2014 AND 9/15/2014 AND 10/1/2014 and 10/15/2014 and so forth but still want to see all the data