Unlock a world of possibilities! Login now and discover the exclusive benefits awaiting you.
- Qlik Community
- :
- All Forums
- :
- QlikView App Dev
- :
- Re: Line chart show value starting and Ending posi...
- Subscribe to RSS Feed
- Mark Topic as New
- Mark Topic as Read
- Float this Topic for Current User
- Bookmark
- Subscribe
- Mute
- Printer Friendly Page
- Mark as New
- Bookmark
- Subscribe
- Mute
- Subscribe to RSS Feed
- Permalink
- Report Inappropriate Content
Line chart show value starting and Ending position
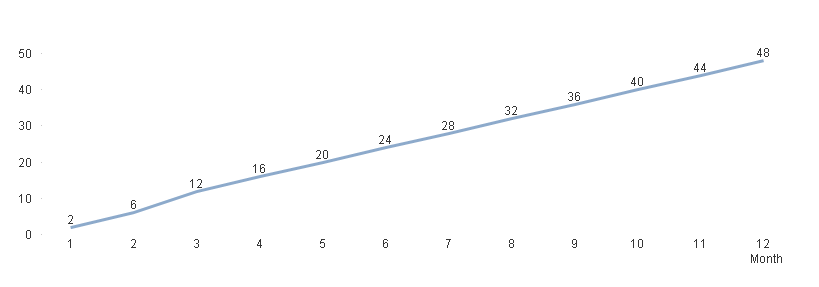
Need help...In the qvw linechart show the value in starting position and ending position(For example to show only2,48)
- Tags:
- chart
- new_to_qlikview
- Mark as New
- Bookmark
- Subscribe
- Mute
- Subscribe to RSS Feed
- Permalink
- Report Inappropriate Content
Not possible with a chart as far as I know.
What you could do to "fake" the solution, is create two transparent Text Objects positioned at the start and at the end of the line. In that Text Object, calculate the value you want to show.
Example expressions (assuming the number you are showing is "Sales"):
= min(aggr(sum(Sales), Month))
= max(aggr(sum(Sales), Month))
Does that help?
- Mark as New
- Bookmark
- Subscribe
- Mute
- Subscribe to RSS Feed
- Permalink
- Report Inappropriate Content
Have a look at this thread: Display / determine value of most recent datapoint in chart?
It will give you a few examples and different ways you can go about it.
- Mark as New
- Bookmark
- Subscribe
- Mute
- Subscribe to RSS Feed
- Permalink
- Report Inappropriate Content
Hi,
one solution could be:
Qlik Tips: Lose the Legend in Line Charts
https://community.qlik.com/thread/168986
hope this helps
regards
Marco