Unlock a world of possibilities! Login now and discover the exclusive benefits awaiting you.
- Qlik Community
- :
- All Forums
- :
- QlikView App Dev
- :
- Re: Line chart
- Subscribe to RSS Feed
- Mark Topic as New
- Mark Topic as Read
- Float this Topic for Current User
- Bookmark
- Subscribe
- Mute
- Printer Friendly Page
- Mark as New
- Bookmark
- Subscribe
- Mute
- Subscribe to RSS Feed
- Permalink
- Report Inappropriate Content
Line chart
I have 3 columns based on the data value i want to show line chart-
| id | Open | closed | status |
| 1 | 9/1/2015 | 9/2/2015 | closed |
| 2 | 9/1/2015 | 9/1/2015 | closed |
| 3 | 9/2/2015 | 9/2/2015 | closed |
| 4 | 9/3/2015 | 9/3/2015 | closed |
| 5 | 9/4/2015 | 9/5/2015 | closed |
| 6 | 9/5/2015 | 9/5/2015 | closed |
| 7 | 9/5/2015 | open |
- Tags:
- line chart
Accepted Solutions
- Mark as New
- Bookmark
- Subscribe
- Mute
- Subscribe to RSS Feed
- Permalink
- Report Inappropriate Content
Hi Suman,
Without changing the script it is not possible to handle this, change your script like below
Data:
LOAD
id,
Open AS Date,
'Day' & Day(Open) AS Day,
'Open' AS Status
FROM DataSource;
Concatenate(Data)
LOAD
id,
closed AS Date,
'Day' & Day(closed) AS Day,
'Close' AS Status
FROM DataSource;
Now in chart simply try like this
Chart : Line Chart
Dimension: Day, Status
Expression: Count(Status)
Hope this helps you.
Regards,
Jagan.
- Mark as New
- Bookmark
- Subscribe
- Mute
- Subscribe to RSS Feed
- Permalink
- Report Inappropriate Content
Sumun, you need to create a new table like below in the script.
id Date Status
1 9/1/2015 Open
1 9/2/2015 Close
2 9/1/2015 Close
.
.
.
.
.
- Mark as New
- Bookmark
- Subscribe
- Mute
- Subscribe to RSS Feed
- Permalink
- Report Inappropriate Content
Thanks for your mail.
Please help me to construct the expression
- Mark as New
- Bookmark
- Subscribe
- Mute
- Subscribe to RSS Feed
- Permalink
- Report Inappropriate Content
Build a qvw model with the data and make your best effort. Then, when you get stuck, you can ask for some assistance. If you have shown that you have put some effort in yourself, you will get much more help from others.
- Mark as New
- Bookmark
- Subscribe
- Mute
- Subscribe to RSS Feed
- Permalink
- Report Inappropriate Content
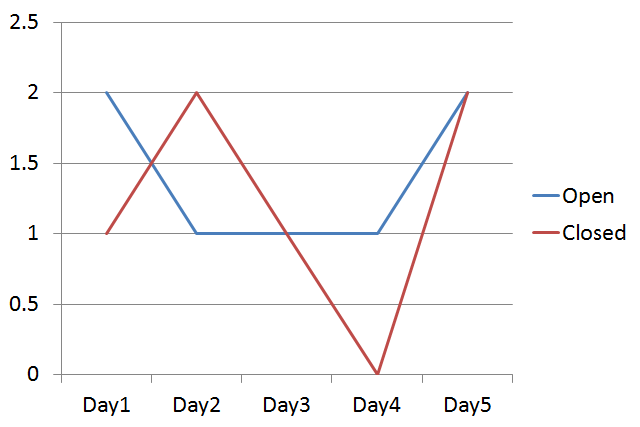
Here Suman take a look 
Notes, the charts have the same results because there are the same 'open' and 'closed' numbers of id's
- Mark as New
- Bookmark
- Subscribe
- Mute
- Subscribe to RSS Feed
- Permalink
- Report Inappropriate Content
That means we need to change the file structure?Without change the structure how can I do that...please help
- Mark as New
- Bookmark
- Subscribe
- Mute
- Subscribe to RSS Feed
- Permalink
- Report Inappropriate Content
Hi,
It is not possible for me to change the file structure.
Open depends on requested date and closed depends on resolved date.
- Mark as New
- Bookmark
- Subscribe
- Mute
- Subscribe to RSS Feed
- Permalink
- Report Inappropriate Content
Thanks for your suggestion ..I have tried but couldn't.
Please help how can we do without change the table structure.
- Mark as New
- Bookmark
- Subscribe
- Mute
- Subscribe to RSS Feed
- Permalink
- Report Inappropriate Content
Hi Suman,
Without changing the script it is not possible to handle this, change your script like below
Data:
LOAD
id,
Open AS Date,
'Day' & Day(Open) AS Day,
'Open' AS Status
FROM DataSource;
Concatenate(Data)
LOAD
id,
closed AS Date,
'Day' & Day(closed) AS Day,
'Close' AS Status
FROM DataSource;
Now in chart simply try like this
Chart : Line Chart
Dimension: Day, Status
Expression: Count(Status)
Hope this helps you.
Regards,
Jagan.