Unlock a world of possibilities! Login now and discover the exclusive benefits awaiting you.
- Qlik Community
- :
- All Forums
- :
- QlikView App Dev
- :
- Line graph changes colour based off new batch #
- Subscribe to RSS Feed
- Mark Topic as New
- Mark Topic as Read
- Float this Topic for Current User
- Bookmark
- Subscribe
- Mute
- Printer Friendly Page
- Mark as New
- Bookmark
- Subscribe
- Mute
- Subscribe to RSS Feed
- Permalink
- Report Inappropriate Content
Line graph changes colour based off new batch #
hi experts,
looking for some advice,
i have a simple line graph, it is a "pooled" line graph that displays all the datapoints for all the "batches", so without filtering or highlighting the graph you dont know what batch is shown.
im looking to see if there is a way to have the line graph background color change dynamically whenever a new batch is shown on the graph? i have it working but i have to put in the batch # myself, this wont work as i have to get the formula working by itself almost?
my current formula for one batch colour change = "if(BATCH ='5002852706', green(), BLUE())"
any ideas on what way to do this?
thanks
- Tags:
- new_to_qlikview
- Mark as New
- Bookmark
- Subscribe
- Mute
- Subscribe to RSS Feed
- Permalink
- Report Inappropriate Content
Hi BSCIknowlec
Interesting issue. What if you create a column for "color" in the batch table ?
You could have a list of colors and link them automatically with the batches.
I hope you find one creative solution!
Best regards
Marcos
- Mark as New
- Bookmark
- Subscribe
- Mute
- Subscribe to RSS Feed
- Permalink
- Report Inappropriate Content
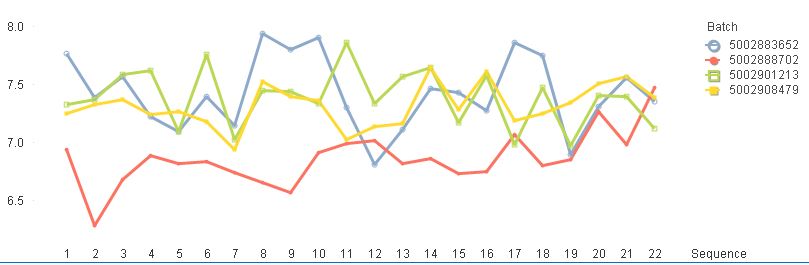
Hi Marcos, thanks for your reply, unfortunately i think i will need to use the standard color's Qlikview displays as i have other charts that would have say a line graph per batch(each different color, see attached example) so i would need to follow that same logic for my pooled line graph as if there was different colors for the same batch # this would confuse the users.
essentially i need a single line graph with the same colors for the batch #s as in the attached.
ciaran