Unlock a world of possibilities! Login now and discover the exclusive benefits awaiting you.
- Qlik Community
- :
- All Forums
- :
- QlikView App Dev
- :
- Linear Trend line for subset of dimension
- Subscribe to RSS Feed
- Mark Topic as New
- Mark Topic as Read
- Float this Topic for Current User
- Bookmark
- Subscribe
- Mute
- Printer Friendly Page
- Mark as New
- Bookmark
- Subscribe
- Mute
- Subscribe to RSS Feed
- Permalink
- Report Inappropriate Content
Linear Trend line for subset of dimension
I have a need to display 12-month sales trend. When all the months have sales amounts, the trend line displays correctly. If the sales amounts are available for a few months only, the default trend line display does not seem to be correct as seen below. How can I set chart properties so that the trend line shows only for the range of months with sales amount? In the following example, I would like to display trend for the last five months only.
An application with sample data is attached. Thank you for your help.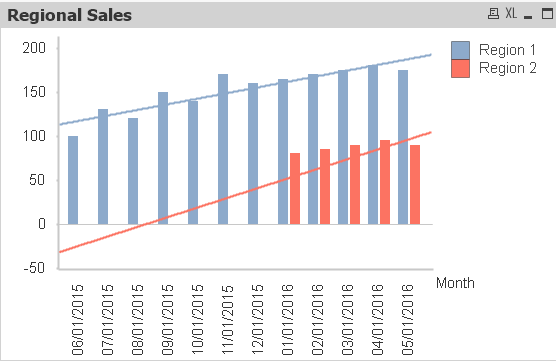
Accepted Solutions
- Mark as New
- Bookmark
- Subscribe
- Mute
- Subscribe to RSS Feed
- Permalink
- Report Inappropriate Content
I don't think there is an option for the linear Trendline option on expression tab to do what you want.
You can look into the linest_m and linest_b function to create your own linear trend, maybe something like
=LINEST_M({<Month = {"=Sum(Region2Sales)>0"}>}TOTAL Aggr(Sum(Region2Sales),Month) ,aggr(Month,Month)) *Only(Month)
+LINEST_B({<Month = {"=Sum(Region2Sales)>0"}>}TOTAL Aggr(Sum(Region2Sales),Month) , Aggr(Month,Month))
- Mark as New
- Bookmark
- Subscribe
- Mute
- Subscribe to RSS Feed
- Permalink
- Report Inappropriate Content
Thank you Stefan. This is what I was looking for.