Unlock a world of possibilities! Login now and discover the exclusive benefits awaiting you.
- Qlik Community
- :
- All Forums
- :
- QlikView App Dev
- :
- Load In Line in script - Apply this in a combo Cha...
- Subscribe to RSS Feed
- Mark Topic as New
- Mark Topic as Read
- Float this Topic for Current User
- Bookmark
- Subscribe
- Mute
- Printer Friendly Page
- Mark as New
- Bookmark
- Subscribe
- Mute
- Subscribe to RSS Feed
- Permalink
- Report Inappropriate Content
Load In Line in script - Apply this in a combo Chart
Hello everyone,
I have several bar charts which display some values (let's say sales) based on weeknumber (at the format YYYY-MM) for and month (at the format monthname-YYYY)
I used a cycle group to display week value and month value. I'm using a master calendar
But the issue is every year the target evolved.
And each year there is a month target and in some case a week target.
And i want to say to qlik view if the weeks or month belongs to a specifi year then apply the target to this specific month or week.
I tried this I tried if(year="maxstring(Year)",Target()) but it didn't work.
So I searched and used the script to load the data i wanted
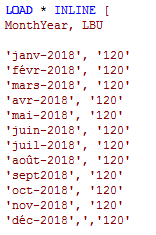
But when I use the combo chat and use that as line it doesn't work either
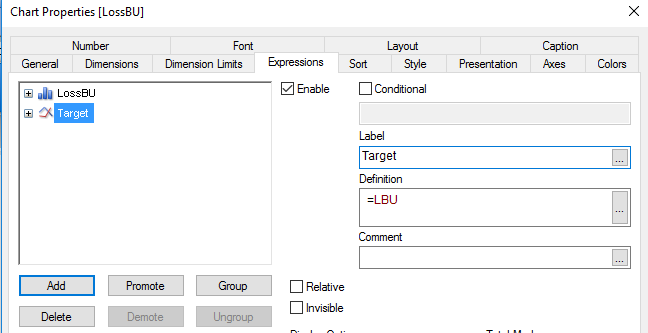
I don't know what the proper formula it is to display the line chart.
Can someone help please
- Mark as New
- Bookmark
- Subscribe
- Mute
- Subscribe to RSS Feed
- Permalink
- Report Inappropriate Content
Hi Yann,
You need to do some kind of aggregation. For example do Sum(LBU).
What is the dimension in this chart? If I understand correctly are you using your Inline table to map to the original target table?
Joseph