Unlock a world of possibilities! Login now and discover the exclusive benefits awaiting you.
- Qlik Community
- :
- All Forums
- :
- QlikView App Dev
- :
- Re: Look at previous month when date is dimension?
- Subscribe to RSS Feed
- Mark Topic as New
- Mark Topic as Read
- Float this Topic for Current User
- Bookmark
- Subscribe
- Mute
- Printer Friendly Page
- Mark as New
- Bookmark
- Subscribe
- Mute
- Subscribe to RSS Feed
- Permalink
- Report Inappropriate Content
Look at previous month when date is dimension?
Hi, I am trying to look to count orders over multiple months when a month is a dimension? ie. For May, I want 3 columns that show the count of orders for May, the count of orders for May + April, and the count of orders for May + April + March. Is this possible?
If below was my data.
| Month | Order Count |
| January | 8 |
| February | 4 |
| March | 5 |
| April | 3 |
| May | 12 |
I would want my chart table to look like below.
| Month | Order Count | Order Count 2 Months | Order Count 3 Months |
| March | 5 | 9 | 17 |
| April | 3 | 8 | 12 |
| May | 12 | 15 | 20 |
Thank you in advance for the help.
Accepted Solutions
- Mark as New
- Bookmark
- Subscribe
- Mute
- Subscribe to RSS Feed
- Permalink
- Report Inappropriate Content
- Mark as New
- Bookmark
- Subscribe
- Mute
- Subscribe to RSS Feed
- Permalink
- Report Inappropriate Content
You can do this e.g. using an AsOf table approach:
- Mark as New
- Bookmark
- Subscribe
- Mute
- Subscribe to RSS Feed
- Permalink
- Report Inappropriate Content
I am not sure if this is the right way of doing it but you can try this :
- Mark as New
- Bookmark
- Subscribe
- Mute
- Subscribe to RSS Feed
- Permalink
- Report Inappropriate Content
You can use "Accumulation" with 2 & 3 steps back to get to your result.
Attached is the example.
- Mark as New
- Bookmark
- Subscribe
- Mute
- Subscribe to RSS Feed
- Permalink
- Report Inappropriate Content
If you are using a personal edition try this:
Dim: Month,
Expr1: Sum(OrderCount)
Expr2:
= IF(Month = 'March', RangeSum(Above(Sum(OrderCount),0,2)),
IF(Month = 'April', RangeSum(Above(Sum(OrderCount),0,2)),
IF(Month = 'May', RangeSum(Above(Sum(OrderCount),0,2)))))
Expr3:
= IF(Month = 'March', RangeSum(Above(Sum(OrderCount),0,3)),
IF(Month = 'April', RangeSum(Above(Sum(OrderCount),0,3)),
IF(Month = 'May', RangeSum(Above(Sum(OrderCount),0,3)))))
Thanks,
V.
- Mark as New
- Bookmark
- Subscribe
- Mute
- Subscribe to RSS Feed
- Permalink
- Report Inappropriate Content
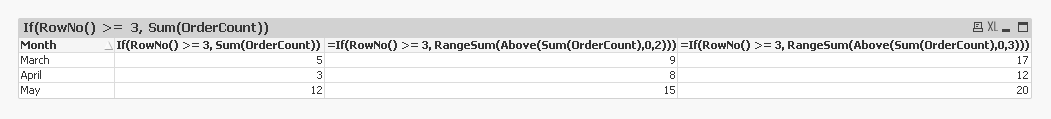
Why so complicated, why not these expressions:
=If(RowNo() >= 3, Sum(OrderCount))
=If(RowNo() >= 3, RangeSum(Above(Sum(OrderCount),0,2)))
=If(RowNo() >= 3, RangeSum(Above(Sum(OrderCount),0,3)))
- Mark as New
- Bookmark
- Subscribe
- Mute
- Subscribe to RSS Feed
- Permalink
- Report Inappropriate Content
Thanks a ton. The As Of Table was exactly what I was looking for. It basically allows me to look at a date point in time, and look back at previous dates for information.