Unlock a world of possibilities! Login now and discover the exclusive benefits awaiting you.
- Qlik Community
- :
- All Forums
- :
- QlikView App Dev
- :
- Re: Make a graphic Employee Growth over time
- Subscribe to RSS Feed
- Mark Topic as New
- Mark Topic as Read
- Float this Topic for Current User
- Bookmark
- Subscribe
- Mute
- Printer Friendly Page
- Mark as New
- Bookmark
- Subscribe
- Mute
- Subscribe to RSS Feed
- Permalink
- Report Inappropriate Content
Make a graphic Employee Growth over time
Hello
I want to make a graphic Employee Growth over time
Année | 2000 | 2012 | 2014 | 2015 |
Employe | 2 | 2+1=3 | 3+1=4 | 4+1-1 |
Explain | 2 New Hire | 2+1New Hire | 3+1New Hire | 4+11New Hire-1Leavrer |
Can i have help please.
Best regards,
- Tags:
- new_to_qlikview
Accepted Solutions
- Mark as New
- Bookmark
- Subscribe
- Mute
- Subscribe to RSS Feed
- Permalink
- Report Inappropriate Content
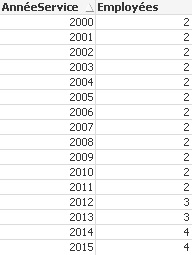
Again my mistake. I misinterpreted your expected values as not counting employees in a specific year if they left in that year. The while expression counts 1 year short for everyone that left the company. Now my question for you: how would we change the while condition so that it counts the year of dismissal as well?
There are two tools in QlikView that prove to be invaluable for debugging a script or data model:
- The table box object can be used to look into an internal table. In this case, create a table box with the two fields of TABLE2. Every EmployeeID should have years that either run up to the current year, or at least up to the year the employee left (here is the problem)
- The Table Viewer can be used to check many (big) tables and fields without creating a table box for each one of them. Note that the table viewer will only show the first 1000 rows.
Best,
Peter
PS Below is a teaser: my output matches your expectations. Only two minor changes required in the while condition.

- Mark as New
- Bookmark
- Subscribe
- Mute
- Subscribe to RSS Feed
- Permalink
- Report Inappropriate Content
Hello. Someone can help me?
I want to make a graphic Employee Growth over time
Année | 2000 | 2012 | 2014 | 2015 |
Employe | 2 | 2+1=3 | 3+1=4 | 4+1-1 |
Explain | 2 New Hire | 2+1New Hire | 3+1New Hire | 4+11New Hire-1Leavrer |
Can i have help please.
Best regards,
- Mark as New
- Bookmark
- Subscribe
- Mute
- Subscribe to RSS Feed
- Permalink
- Report Inappropriate Content
Yes, I can. but this time no ready-made solution but rather an exercise. Some thinking is required ![]()
You have a field called Année, but let's skip that one to make it a bit easier. We'll create a new field in a moment.
After loading the initial QVD, in your script create a new table from the resident version of FAITDH. Copy the employee ID and create a new year field that is based on year(DateEmbauche) and adds the value IterNo() - 1. The employee ID should act as a key to connect the new table to the employee table, and in the new field, we'll be putting the years that a particular employee has been active in the company. The last (partial) one will be skipped. You'll do this with the WHILE clause that generates records as long as a condition is met, for example:
LOAD
:
RESIDENT FAITDH
WHILE year(DateEmbauche) + IterNo() - 1 < year(DateRetraite);
As soon as you have this second table, create a straight table with the new year field from the second table as dimension, and as expression a count of distinct Exmployee ID key values.
Note that there are cases that have no DateRetraite and therefor year(DateRetraite) will be NULL. You can use the alt() function to switch back to year(Today())+1 for those cases.
Best,
Peter
- Mark as New
- Bookmark
- Subscribe
- Mute
- Subscribe to RSS Feed
- Permalink
- Report Inappropriate Content
Hello Peter.
Thank you for this exrcice this perms me to learn QlikView.
This is the srip of the second table:
TABLE2:
LOADMatricule,
//date(DateEmbauche,'DD/MM/YYYY') as DateEmbauche1,
year(date(DateEmbauche,'DD/MM/YYYY')),
IterNo()-1
Resident FAITDH
whileyear(date(DateEmbauche,'DD/MM/YYYY'))+IterNo()-1<if(isnull(DateRetraite),alt(year(Today())+1),Year(date(DateRetraite,'DD/MM/YYYY')));
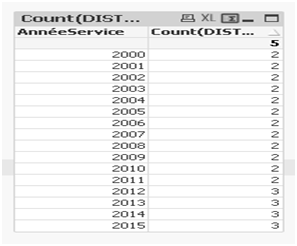
Here is the result on a straight table

In fact in 2015 we have 4+1-1=4 (4+ 1New Hire - 1Leavrer) emploiye instead of 5.
- Mark as New
- Bookmark
- Subscribe
- Mute
- Subscribe to RSS Feed
- Permalink
- Report Inappropriate Content
Almost perfect. The mistakes are due to my (bad) explanation, so here goes round two.
- Change the second and third column into a single one as follows::
:
year(DateEmbauche) + IterNo() - 1 AS AnnéeEnService,
:
Use this field as dimension. - The WHILE clause may work, but it looks a bit complicated. The Alt() function itself will decide whether a value is NULL or not, so you can simplify the whole condition as follows:
WHILE year(DateEmbauche) + IterNo() -1 < alt(Year(DateRetraite), Year(Today())+1);
The left part should be the same as what you are putting in the new column. If alt() detects a NULL value as first parameter, it will check/use the second parameter (and so on).
BTW I'm assuming that your date values correspond to the format that is defined at the top of your script. In that case, there is no need to use date() to format values. date() is not an interpretation function.
- Mark as New
- Bookmark
- Subscribe
- Mute
- Subscribe to RSS Feed
- Permalink
- Report Inappropriate Content
Hello Peter.
This is the srip of the new second table:
TABLE2 :
LOADMatricule,
//date(DateEmbauche,'DD/MM/YYYY') as DateEmbauche1,
year(date(DateEmbauche,'DD/MM/YYYY'))+IterNo()-1 asAnnéeService
Resident FAITDH
whileyear(date(DateEmbauche,'DD/MM/YYYY'))+IterNo()-1<alt(year(date(DateRetraite,'DD/MM/YYYY')),year(Today())+1);
Here is the result on a straight table

I use date with DateRetraite because DateRetraite are not a date forma.
I hope we take the distance from the result!
Best regards
- Mark as New
- Bookmark
- Subscribe
- Mute
- Subscribe to RSS Feed
- Permalink
- Report Inappropriate Content
Again my mistake. I misinterpreted your expected values as not counting employees in a specific year if they left in that year. The while expression counts 1 year short for everyone that left the company. Now my question for you: how would we change the while condition so that it counts the year of dismissal as well?
There are two tools in QlikView that prove to be invaluable for debugging a script or data model:
- The table box object can be used to look into an internal table. In this case, create a table box with the two fields of TABLE2. Every EmployeeID should have years that either run up to the current year, or at least up to the year the employee left (here is the problem)
- The Table Viewer can be used to check many (big) tables and fields without creating a table box for each one of them. Note that the table viewer will only show the first 1000 rows.
Best,
Peter
PS Below is a teaser: my output matches your expectations. Only two minor changes required in the while condition.

- Mark as New
- Bookmark
- Subscribe
- Mute
- Subscribe to RSS Feed
- Permalink
- Report Inappropriate Content
Hello Peter.
Afer our observation,
This is the srip of the new second table:
TABLE2:
LOADMatricule,
//date(DateEmbauche,'DD/MM/YYYY') as DateEmbauche1,
year(date(DateEmbauche,'DD/MM/YYYY'))+IterNo()-1 asAnnéeService
Resident FAITDH
whileyear(date(DateEmbauche,'DD/MM/YYYY'))+IterNo()-1<=alt(year(date(DateRetraite,'DD/MM/YYYY')),year(Today()));
This is the result:

I think that it's ok now.
Thank you very much.
Best regards
- Mark as New
- Bookmark
- Subscribe
- Mute
- Subscribe to RSS Feed
- Permalink
- Report Inappropriate Content
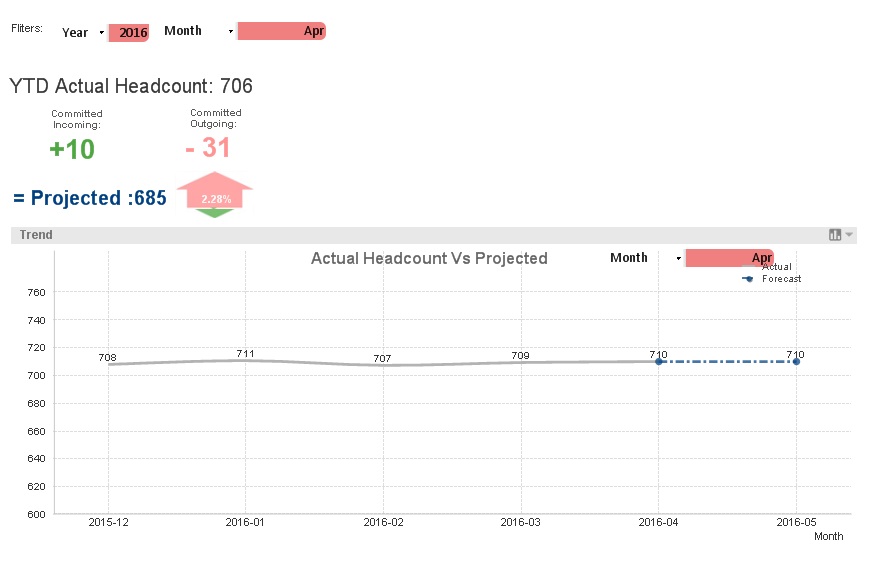
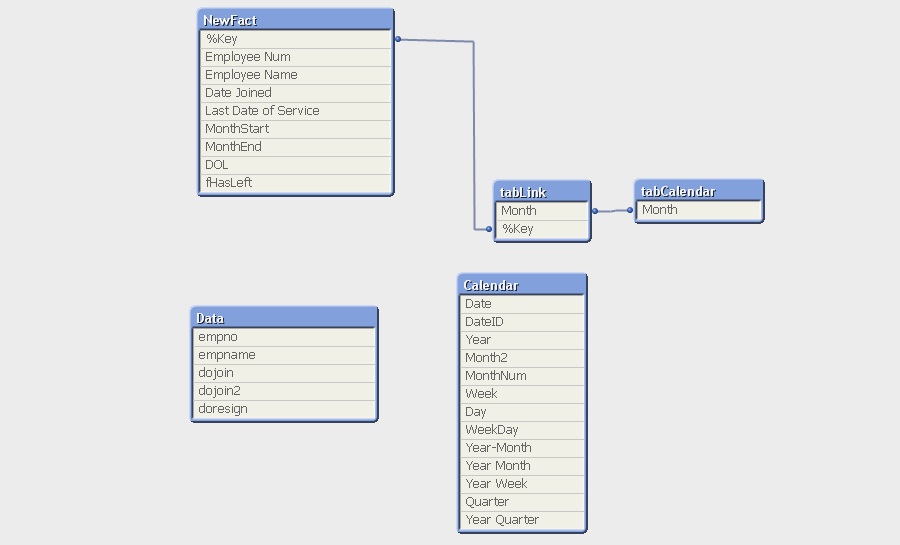
This is interesting!
Does anyone have any idea how to combine the two calendars in my data model? Im trying to show graphic projected MTD figures,

