Unlock a world of possibilities! Login now and discover the exclusive benefits awaiting you.
- Qlik Community
- :
- All Forums
- :
- QlikView App Dev
- :
- Making Pivot from different files with same column
- Subscribe to RSS Feed
- Mark Topic as New
- Mark Topic as Read
- Float this Topic for Current User
- Bookmark
- Subscribe
- Mute
- Printer Friendly Page
- Mark as New
- Bookmark
- Subscribe
- Mute
- Subscribe to RSS Feed
- Permalink
- Report Inappropriate Content
Making Pivot from different files with same column
Dear all,
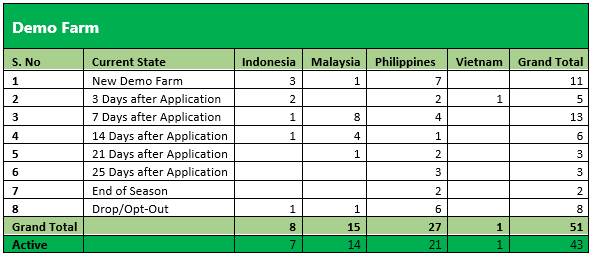
Could you please help me to get the data in below format because when I am loading the data then it is adding the counts at one place but I need it country wise. I have separate file for all countries and there is no column of country in file.
Accepted Solutions
- Mark as New
- Bookmark
- Subscribe
- Mute
- Subscribe to RSS Feed
- Permalink
- Report Inappropriate Content
Hi,
we can build the report we need to excel source file, but u can also try to add country and concatenate them as one fact refer below script.
create pivot table chart,
dimension
[Current State]
Country
(after adding try to enable check box for "always fully expanded" chart property presentation tab and country field u have to transpose Country from row to column )
Measure:
=Count([Lead Code])
Fact:
//IndonesiaDemoFarm:
LOAD 'Indonesia' as Country,
[Lead Code],
    [Assigned To],
    [User ID],
    [Creation Date],
    [Current State]
FROM
(ooxml, embedded labels, table is [Indonesia DemoFarm]);
Concatenate
//MalaysiaDemoFarm:
LOAD 'Malaysia' as Country,
[Lead Code],
    [Assigned To],
    [User ID],
    [Creation Date],
    [Current State]
FROM

(ooxml, embedded labels, table is [Malaysia Demo Farm]);
Concatenate
//PhilippinesDemofarm:
LOAD Country,
    [Lead Code],
    [Assigned To],
    [User ID],
    [Creation Date],
    [Current State]
FROM

(ooxml, embedded labels, table is [Philippines Demofarm]);
Concatenate
//VietnamDemoFarm:
LOAD
'Vietnam' as Country,
[Lead Code],
    [Assigned To],
    [User ID],
    [Creation Date],
    [Current State]
FROM

(ooxml, embedded labels, table is [Vietnam DemoFarm]);
- Mark as New
- Bookmark
- Subscribe
- Mute
- Subscribe to RSS Feed
- Permalink
- Report Inappropriate Content
We can make calc. Dimension but not really sure how you want to split each
ValueList('Indonesia', 'Malaysia', 'Philippines', 'Vietnam')
- Mark as New
- Bookmark
- Subscribe
- Mute
- Subscribe to RSS Feed
- Permalink
- Report Inappropriate Content
Hi,
we can build the report we need to excel source file, but u can also try to add country and concatenate them as one fact refer below script.
create pivot table chart,
dimension
[Current State]
Country
(after adding try to enable check box for "always fully expanded" chart property presentation tab and country field u have to transpose Country from row to column )
Measure:
=Count([Lead Code])
Fact:
//IndonesiaDemoFarm:
LOAD 'Indonesia' as Country,
[Lead Code],
    [Assigned To],
    [User ID],
    [Creation Date],
    [Current State]
FROM
(ooxml, embedded labels, table is [Indonesia DemoFarm]);
Concatenate
//MalaysiaDemoFarm:
LOAD 'Malaysia' as Country,
[Lead Code],
    [Assigned To],
    [User ID],
    [Creation Date],
    [Current State]
FROM

(ooxml, embedded labels, table is [Malaysia Demo Farm]);
Concatenate
//PhilippinesDemofarm:
LOAD Country,
    [Lead Code],
    [Assigned To],
    [User ID],
    [Creation Date],
    [Current State]
FROM

(ooxml, embedded labels, table is [Philippines Demofarm]);
Concatenate
//VietnamDemoFarm:
LOAD
'Vietnam' as Country,
[Lead Code],
    [Assigned To],
    [User ID],
    [Creation Date],
    [Current State]
FROM

(ooxml, embedded labels, table is [Vietnam DemoFarm]);
- Mark as New
- Bookmark
- Subscribe
- Mute
- Subscribe to RSS Feed
- Permalink
- Report Inappropriate Content
Thanks a lot Devarasu and Anil. It is working perfectly.
- Mark as New
- Bookmark
- Subscribe
- Mute
- Subscribe to RSS Feed
- Permalink
- Report Inappropriate Content
Hi,
Close this thread by marking as helpful and correct. thanks 
- Mark as New
- Bookmark
- Subscribe
- Mute
- Subscribe to RSS Feed
- Permalink
- Report Inappropriate Content
Dear, Only Helpfull is coming in list. Correct Answer is not coming.