Unlock a world of possibilities! Login now and discover the exclusive benefits awaiting you.
- Qlik Community
- :
- All Forums
- :
- QlikView App Dev
- :
- Max value color change in pivot table
- Subscribe to RSS Feed
- Mark Topic as New
- Mark Topic as Read
- Float this Topic for Current User
- Bookmark
- Subscribe
- Mute
- Printer Friendly Page
- Mark as New
- Bookmark
- Subscribe
- Mute
- Subscribe to RSS Feed
- Permalink
- Report Inappropriate Content
Max value color change in pivot table
Hi,
How to Change max rate color in pivot chart.. rate get from avg(rate).
With Regards,
Muni.
Accepted Solutions
- Mark as New
- Bookmark
- Subscribe
- Mute
- Subscribe to RSS Feed
- Permalink
- Report Inappropriate Content
Then change expresion to:
if(avg(rate)=max(total <City,[Item Name]> rate),rgb(0,0,255),'')
and you will get:

Regards,
David
- Mark as New
- Bookmark
- Subscribe
- Mute
- Subscribe to RSS Feed
- Permalink
- Report Inappropriate Content
Hi,
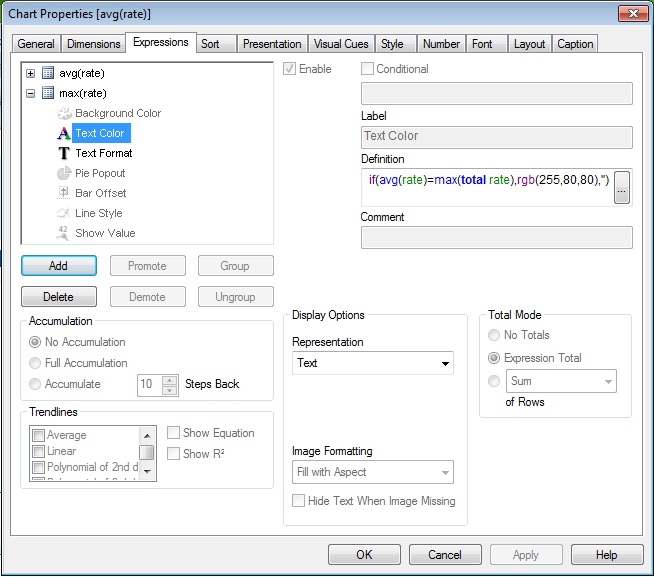
Try this:

Dave
- Mark as New
- Bookmark
- Subscribe
- Mute
- Subscribe to RSS Feed
- Permalink
- Report Inappropriate Content
Hi daveamz01,
this expression working,But different city,item,customer added. this expression not working.
With Regards,
Muni.
- Mark as New
- Bookmark
- Subscribe
- Mute
- Subscribe to RSS Feed
- Permalink
- Report Inappropriate Content
Then change expresion to:
if(avg(rate)=max(total <City,[Item Name]> rate),rgb(0,0,255),'')
and you will get:

Regards,
David
- Mark as New
- Bookmark
- Subscribe
- Mute
- Subscribe to RSS Feed
- Permalink
- Report Inappropriate Content
Thanks Dave,
it's working. in am new to qlikview. what is mean by < City,[Item Name] >
Muni
- Mark as New
- Bookmark
- Subscribe
- Mute
- Subscribe to RSS Feed
- Permalink
- Report Inappropriate Content
You can have different max values depends on what you what to relate on: eg. max(rate) for all values is 83, for each item is 33 for M 1 KG and 88 for M 1 5 KG.
Same for sum, avg expressions.
See the file attached.
- Mark as New
- Bookmark
- Subscribe
- Mute
- Subscribe to RSS Feed
- Permalink
- Report Inappropriate Content
Thanks Dave.