Unlock a world of possibilities! Login now and discover the exclusive benefits awaiting you.
- Qlik Community
- :
- All Forums
- :
- QlikView App Dev
- :
- Re: Merging 2 Charts Into 1
- Subscribe to RSS Feed
- Mark Topic as New
- Mark Topic as Read
- Float this Topic for Current User
- Bookmark
- Subscribe
- Mute
- Printer Friendly Page
- Mark as New
- Bookmark
- Subscribe
- Mute
- Subscribe to RSS Feed
- Permalink
- Report Inappropriate Content
Merging 2 Charts Into 1
Hi, everyone.
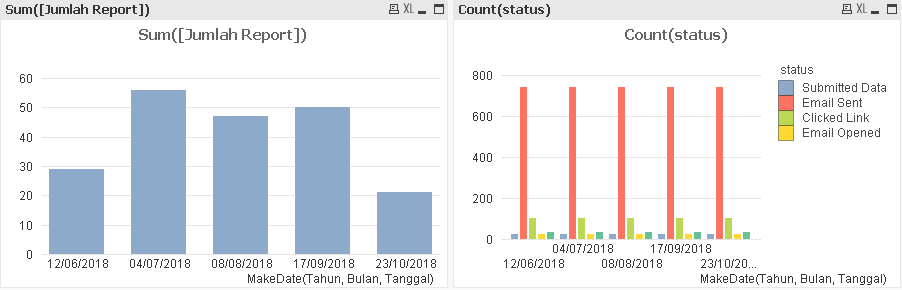
Can I combine this 2 charts into only 1 chart ?
The Jumlah Report chart will be embedded into Status chart as a new bar (it's already in the same date each other).
Here's the pict :
Can anyone teach me the way how to do this ?
Thank you.
- Kevin
Accepted Solutions
- Mark as New
- Bookmark
- Subscribe
- Mute
- Subscribe to RSS Feed
- Permalink
- Report Inappropriate Content
Try
count( {<Status={'Submitted Data'}>} Status)
count( {<Status={'Email Opened'}>} Status)
count( {<Status={'Clicked Link'}>} Status)
count( {<Status={'Email Sent'}>} Status)
Sum(DISTINCT [Emails Reported])
attached app for reference
- Mark as New
- Bookmark
- Subscribe
- Mute
- Subscribe to RSS Feed
- Permalink
- Report Inappropriate Content
Hi,
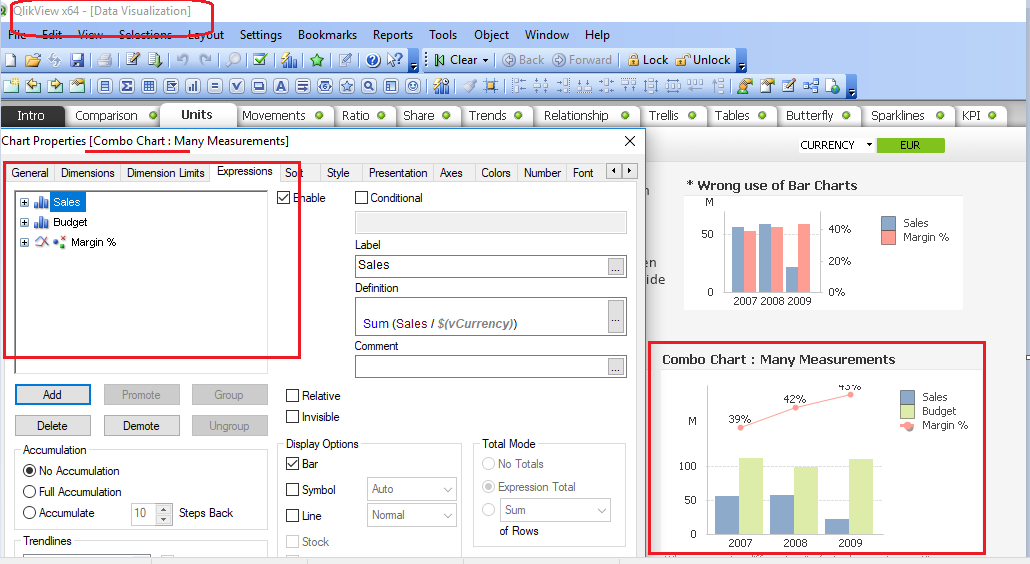
Please check 'Combo chart'.
It will suitable to your requirement.
- Mark as New
- Bookmark
- Subscribe
- Mute
- Subscribe to RSS Feed
- Permalink
- Report Inappropriate Content
Thank you for the response.
In the other case, can I make the Jumlah Report as a new status ? As same as the Submitted Data, Email Sent, etc
- Mark as New
- Bookmark
- Subscribe
- Mute
- Subscribe to RSS Feed
- Permalink
- Report Inappropriate Content
Can you attach some sample data.
- Mark as New
- Bookmark
- Subscribe
- Mute
- Subscribe to RSS Feed
- Permalink
- Report Inappropriate Content
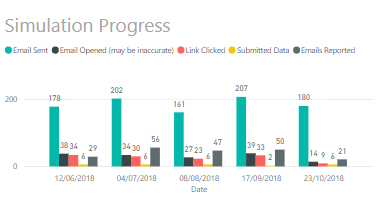
Like this : (in this chart, assume the Jumlah Report chart as the Emails Reported bar)
- Mark as New
- Bookmark
- Subscribe
- Mute
- Subscribe to RSS Feed
- Permalink
- Report Inappropriate Content
Where is your source data? It is challenging the folks without data and asking for solution.
- Mark as New
- Bookmark
- Subscribe
- Mute
- Subscribe to RSS Feed
- Permalink
- Report Inappropriate Content
measure 1 = sum(Jumlah report)
measure 2 = Count({<Status = 'Submitted Data'>} X)
measure 3 = Count({<Status = 'Email Sent'>} X)
measure 4 = Count({<Status = 'Clicked Link'>} X)
measure 5 = Count({<Status = 'Email Opened'>} X)
Dimension = Date
- Mark as New
- Bookmark
- Subscribe
- Mute
- Subscribe to RSS Feed
- Permalink
- Report Inappropriate Content
Here you are 
So sorry if it's too much for you 
- Mark as New
- Bookmark
- Subscribe
- Mute
- Subscribe to RSS Feed
- Permalink
- Report Inappropriate Content
Try
count( {<Status={'Submitted Data'}>} Status)
count( {<Status={'Email Opened'}>} Status)
count( {<Status={'Clicked Link'}>} Status)
count( {<Status={'Email Sent'}>} Status)
Sum(DISTINCT [Emails Reported])
attached app for reference
- Mark as New
- Bookmark
- Subscribe
- Mute
- Subscribe to RSS Feed
- Permalink
- Report Inappropriate Content
Thank you so much everyone for the whole responses