Unlock a world of possibilities! Login now and discover the exclusive benefits awaiting you.
- Qlik Community
- :
- All Forums
- :
- QlikView App Dev
- :
- Missing accumulated values in BarChart
- Subscribe to RSS Feed
- Mark Topic as New
- Mark Topic as Read
- Float this Topic for Current User
- Bookmark
- Subscribe
- Mute
- Printer Friendly Page
- Mark as New
- Bookmark
- Subscribe
- Mute
- Subscribe to RSS Feed
- Permalink
- Report Inappropriate Content
Missing accumulated values in BarChart
Hello everybody,
I try to create a chart that shows my individual transactions in accumulated manner. The presentation takes place in two different categories.
Problem: For Channel = Geldanlage payments do not take place every month.
Thus, the sum is not continuously aggregated, but only if payments were made this month.
The green bars on the Chart should be shown aggregated in every month.
Is there a way to fix this by an Expression?
My actual Expression is sum(Amount)
Accepted Solutions
- Mark as New
- Bookmark
- Subscribe
- Mute
- Subscribe to RSS Feed
- Permalink
- Report Inappropriate Content
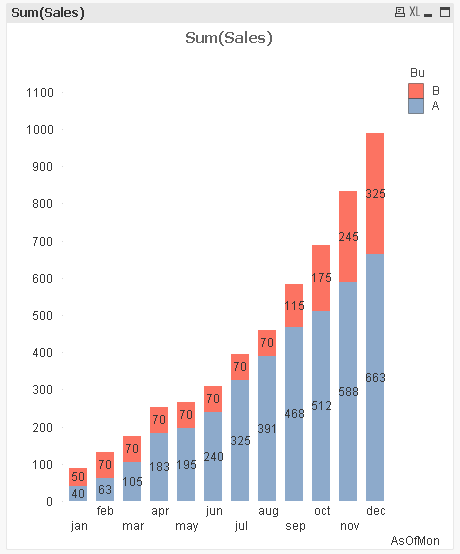
You can either create records for all combinations of Mon and Bu (with NULL or zero for Sales), or look into the AsOf table concept:
Using an as-of table should help you to get your Sales values correctly accumulated, see attached.

- Mark as New
- Bookmark
- Subscribe
- Mute
- Subscribe to RSS Feed
- Permalink
- Report Inappropriate Content
It's a little unclear how your data model and data look like and where the accumulation of Rente takes place.
Maybe something like
=Sum({<Channel = {Rente}>} Betrag) +
RangeSum(Above( Sum({<Channel = {Geldanlage}>} Betrag),0,Rowno()))
- Mark as New
- Bookmark
- Subscribe
- Mute
- Subscribe to RSS Feed
- Permalink
- Report Inappropriate Content
try this expression: Rangesum(above(sum(Sales),0,RowNo()))
for more detail refer below example:
LOAD * INLINE [
Mon, Sales , Bu
jan, 40, A
feb, 23, A
mar, 42, A
apr, 78, A
may, 12, A
jun, 45, A
jul, 85, A
aug, 66, A
sep, 77, A
oct, 44, A
nov, 76, A
dec, 75, A
jan, 50, B
feb, 20, B
mar, 0, B
apr, 0, B
may, 0, B
jun, 0, B
jul, 0, B
aug, 0, B
sep, 45, B
oct, 60, B
nov, 70, B
dec, 80, B
];
Exp: Rangesum(above(sum(Sales),0,RowNo()))
- Mark as New
- Bookmark
- Subscribe
- Mute
- Subscribe to RSS Feed
- Permalink
- Report Inappropriate Content
Due to missing value for Channel=Rente and for that perticular date/month, chart is not calculating the sum
- Mark as New
- Bookmark
- Subscribe
- Mute
- Subscribe to RSS Feed
- Permalink
- Report Inappropriate Content
Hi daniel,
As you do not have amount for some months and because of that accumulation for month where amount =0 is not visible in your chart.
to resolve this you can use below expression :
if(sum(Sales)=0,0.0001,Sum(Sales))
need to set number format of this exp to "fixed to 0"
- Mark as New
- Bookmark
- Subscribe
- Mute
- Subscribe to RSS Feed
- Permalink
- Report Inappropriate Content
Thank you for your help.
Your idea sounds good.
But if I take out line aug, 0, B from your data set, then we have my Problem.
LOAD * INLINE [
Mon, Sales , Bu
jan, 40, A
feb, 23, A
mar, 42, A
apr, 78, A
may, 12, A
jun, 45, A
jul, 85, A
aug, 66, A
sep, 77, A
oct, 44, A
nov, 76, A
dec, 75, A
jan, 50, B
feb, 20, B
mar, 0, B
apr, 0, B
may, 0, B
jun, 0, B
jul, 0, B
sep, 45, B
oct, 60, B
nov, 70, B
dec, 80, B
];
- Mark as New
- Bookmark
- Subscribe
- Mute
- Subscribe to RSS Feed
- Permalink
- Report Inappropriate Content
You can either create records for all combinations of Mon and Bu (with NULL or zero for Sales), or look into the AsOf table concept:
Using an as-of table should help you to get your Sales values correctly accumulated, see attached.
