Unlock a world of possibilities! Login now and discover the exclusive benefits awaiting you.
- Qlik Community
- :
- All Forums
- :
- QlikView App Dev
- :
- Re: Missing some data that needs to be there.
- Subscribe to RSS Feed
- Mark Topic as New
- Mark Topic as Read
- Float this Topic for Current User
- Bookmark
- Subscribe
- Mute
- Printer Friendly Page
- Mark as New
- Bookmark
- Subscribe
- Mute
- Subscribe to RSS Feed
- Permalink
- Report Inappropriate Content
Missing some data that needs to be there.
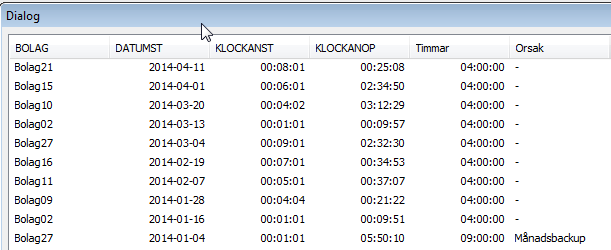
I have a simple sql database that contains fowling fields.
Bolag, DATUMST, KLOCKANST, KLOCKANOP, Timmar

What it shows is how long time a company (bolag) is unavailable , Time stop (KLOCKANST), timestart (KLOCKANOP) and approved downtime (timmar)
In the script I just load it
SLA:
LOAD
BOLAG,
DATUMST,
KLOCKANST,
KLOCKANOP,
Timmar,
Orsak;
SQL SELECT *
FROM "SLA".dbo.Rapportunderlag;
I also connect a master calendar to it.
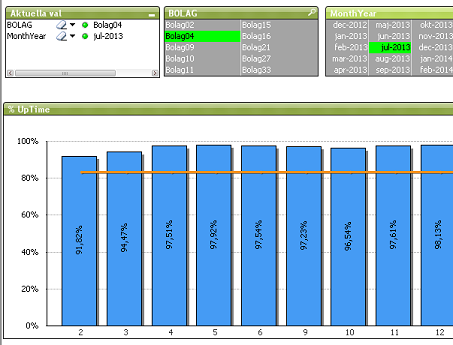
Then in the graph I do some calculations to show it like this.

But as you can see some dates are missing, and that is because the database doesn’t contain all dates. And when it is missing it means that uptime is 100%. If I show “ All values” then I get 31 days in February. So how will I solve it ? I think I need to add data within the scrip but how.
- Tags:
- new_to_qlikview
- Mark as New
- Bookmark
- Subscribe
- Mute
- Subscribe to RSS Feed
- Permalink
- Report Inappropriate Content
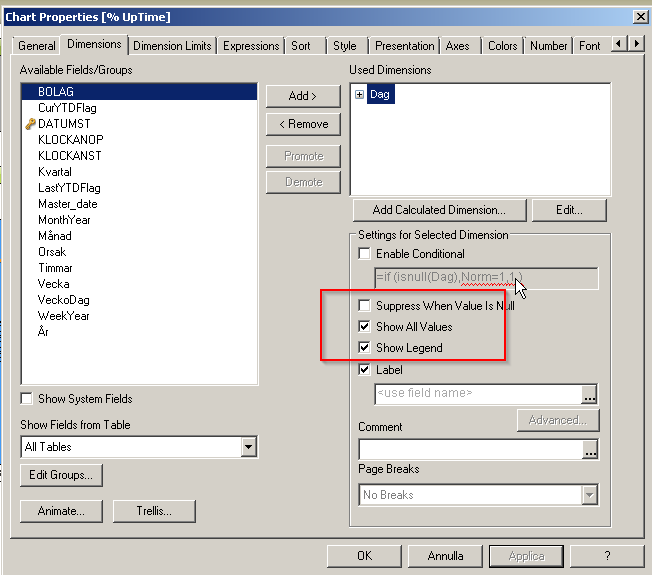
Have you tried enabling the options Suppress When Value Is Null and Show All Values for the Dag dimension?
talk is cheap, supply exceeds demand
- Mark as New
- Bookmark
- Subscribe
- Mute
- Subscribe to RSS Feed
- Permalink
- Report Inappropriate Content
Yes and it wont change anything
- Mark as New
- Bookmark
- Subscribe
- Mute
- Subscribe to RSS Feed
- Permalink
- Report Inappropriate Content

- Mark as New
- Bookmark
- Subscribe
- Mute
- Subscribe to RSS Feed
- Permalink
- Report Inappropriate Content
If I "Show All values” then I get 31 days in February.