Unlock a world of possibilities! Login now and discover the exclusive benefits awaiting you.
- Qlik Community
- :
- All Forums
- :
- QlikView App Dev
- :
- Re: Month Year
- Subscribe to RSS Feed
- Mark Topic as New
- Mark Topic as Read
- Float this Topic for Current User
- Bookmark
- Subscribe
- Mute
- Printer Friendly Page
- Mark as New
- Bookmark
- Subscribe
- Mute
- Subscribe to RSS Feed
- Permalink
- Report Inappropriate Content
Month Year
Hi Experts !
In my db month field is maintained in numeric form i.e 1,2,3,--12. and year field is also numeric like 2018,2019 and so on.
I want to display month year as a dimension in a bar chart. Any Ideas of how to achieve this field inside QV.
Thanks.
- Tags:
- qlikview_scripting
- « Previous Replies
-
- 1
- 2
- Next Replies »
Accepted Solutions
- Mark as New
- Bookmark
- Subscribe
- Mute
- Subscribe to RSS Feed
- Permalink
- Report Inappropriate Content
...
Date(MakeDate(YearField, MonthField), 'yyyy-MM') as Date,
Month(MakeDate(YearField, MonthField)) as Month,
YearField as Year,
...
- Mark as New
- Bookmark
- Subscribe
- Mute
- Subscribe to RSS Feed
- Permalink
- Report Inappropriate Content
Hi Sudhir,
Please find below code -
Month(MonthField) &'-'& YearField as Year-Month
Thanks
- Mark as New
- Bookmark
- Subscribe
- Mute
- Subscribe to RSS Feed
- Permalink
- Report Inappropriate Content
Thanks for the reply but it's not working. Its combined and Only 3 months are displaying.
- Mark as New
- Bookmark
- Subscribe
- Mute
- Subscribe to RSS Feed
- Permalink
- Report Inappropriate Content
Can you share the screenshots of the code written by you and output ?
Thanks
- Mark as New
- Bookmark
- Subscribe
- Mute
- Subscribe to RSS Feed
- Permalink
- Report Inappropriate Content
- Mark as New
- Bookmark
- Subscribe
- Mute
- Subscribe to RSS Feed
- Permalink
- Report Inappropriate Content
- Mark as New
- Bookmark
- Subscribe
- Mute
- Subscribe to RSS Feed
- Permalink
- Report Inappropriate Content
You need to create Master Calendar or else you will get not consistent Year-Month dimension.
Use simply Year & Month as [Year Month]
- Mark as New
- Bookmark
- Subscribe
- Mute
- Subscribe to RSS Feed
- Permalink
- Report Inappropriate Content
...
Date(MakeDate(YearField, MonthField), 'yyyy-MM') as Date,
Month(MakeDate(YearField, MonthField)) as Month,
YearField as Year,
...
- Mark as New
- Bookmark
- Subscribe
- Mute
- Subscribe to RSS Feed
- Permalink
- Report Inappropriate Content
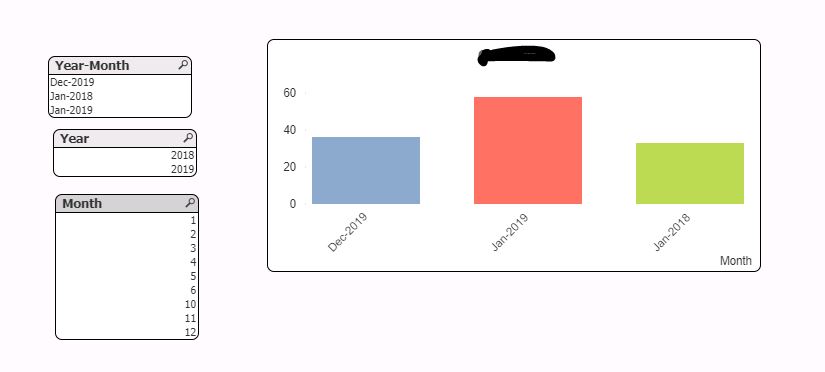
Hi iJonty,
Thanks for sharing the work around. It really works. Here in the dimension i want to show the months in descending format for only last 12 months. like today is month of July 2019 so data will be of July 2018 to July 2019. July 18/2018 August 2018 Sep 2018 and after dec 2018 jan 2019 should appear but not july 2019.
Can you help me achieve this. screenshot attached
- Mark as New
- Bookmark
- Subscribe
- Mute
- Subscribe to RSS Feed
- Permalink
- Report Inappropriate Content
You are asking a new question now. I suggest that you mark this thread as answered (if you original question was answered) and open a new posting with the question. You can link back to this post if necessary.
I did not really understand what you were looking for in the new question and the screenshot did not help much. In the new post, please explain in more detail what you need and include a sample qvw (or a focussed screenshot) that illustrates the question more clearly.
- « Previous Replies
-
- 1
- 2
- Next Replies »