Unlock a world of possibilities! Login now and discover the exclusive benefits awaiting you.
- Qlik Community
- :
- All Forums
- :
- QlikView App Dev
- :
- Re: Month going across the top
- Subscribe to RSS Feed
- Mark Topic as New
- Mark Topic as Read
- Float this Topic for Current User
- Bookmark
- Subscribe
- Mute
- Printer Friendly Page
- Mark as New
- Bookmark
- Subscribe
- Mute
- Subscribe to RSS Feed
- Permalink
- Report Inappropriate Content
Month going across the top
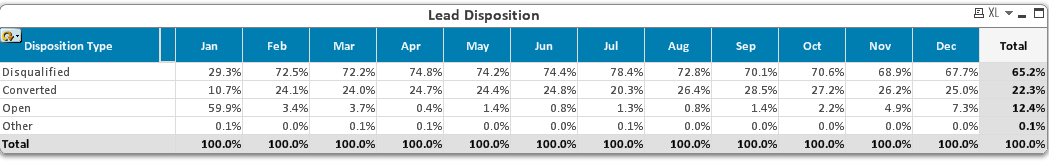
I was trying get QV to do something similar to the image below but I am stumped. Any advise?
- « Previous Replies
-
- 1
- 2
- Next Replies »
- Mark as New
- Bookmark
- Subscribe
- Mute
- Subscribe to RSS Feed
- Permalink
- Report Inappropriate Content
Is this a pivot table?
How are you trying to get the month row?
- Mark as New
- Bookmark
- Subscribe
- Mute
- Subscribe to RSS Feed
- Permalink
- Report Inappropriate Content
Yes it is a pivot table.
- Mark as New
- Bookmark
- Subscribe
- Mute
- Subscribe to RSS Feed
- Permalink
- Report Inappropriate Content
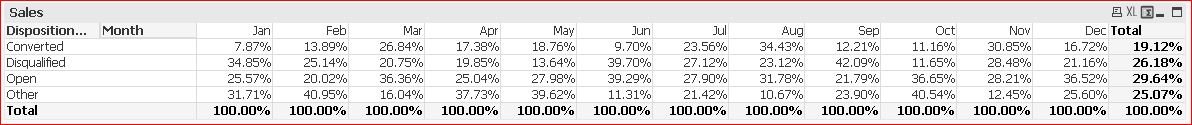
Hi,
Check the Attachment. May be helps..
Just used Pivot with the expression like
Sum(Aggr(sum(Sales)/sum(TOTAL Sales),Month,[Disposition Type]))
As per jontydkpi Suggestion..
Sum(Sales)/sum(TOTAL <Month> Sales)
- Mark as New
- Bookmark
- Subscribe
- Mute
- Subscribe to RSS Feed
- Permalink
- Report Inappropriate Content
Expression:
sum(Field_Name)/sum(total <Month>Field_Name)
Number Format: Fixed to 2 digits & show in %
- Mark as New
- Bookmark
- Subscribe
- Mute
- Subscribe to RSS Feed
- Permalink
- Report Inappropriate Content
You can simplify that expression:
Sum(Aggr(sum(Sales)/sum(TOTAL Sales),Month,[Disposition Type]))
to
Sum(Sales)/sum(TOTAL <Month> Sales)
- Mark as New
- Bookmark
- Subscribe
- Mute
- Subscribe to RSS Feed
- Permalink
- Report Inappropriate Content
Thank You jontydkpi
I will update the same in my attachment..
- Mark as New
- Bookmark
- Subscribe
- Mute
- Subscribe to RSS Feed
- Permalink
- Report Inappropriate Content
I got the expression part down but it is still not showing the months in each column. It looks like this right now;.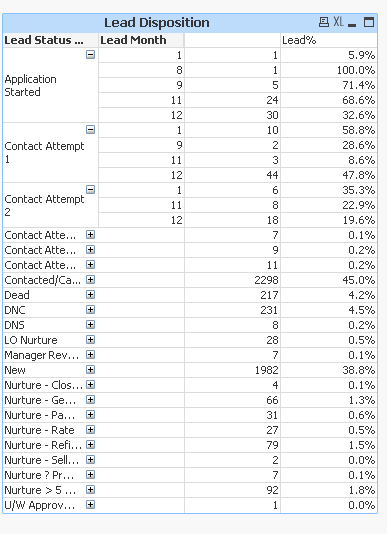
- Mark as New
- Bookmark
- Subscribe
- Mute
- Subscribe to RSS Feed
- Permalink
- Report Inappropriate Content
Drag the "Lead Month" column heading to the upper right corner of the chart and drop it there.
-Rob
- Mark as New
- Bookmark
- Subscribe
- Mute
- Subscribe to RSS Feed
- Permalink
- Report Inappropriate Content
works now. How can I sort it ascending by month?
- « Previous Replies
-
- 1
- 2
- Next Replies »