Unlock a world of possibilities! Login now and discover the exclusive benefits awaiting you.
- Qlik Community
- :
- All Forums
- :
- QlikView App Dev
- :
- Re: Month to Date using Master Calendar
- Subscribe to RSS Feed
- Mark Topic as New
- Mark Topic as Read
- Float this Topic for Current User
- Bookmark
- Subscribe
- Mute
- Printer Friendly Page
- Mark as New
- Bookmark
- Subscribe
- Mute
- Subscribe to RSS Feed
- Permalink
- Report Inappropriate Content
Month to Date using Master Calendar
I am using a master calendar with built in flags and want to calculate MTD for the chosen month, M -1 , M -2.
I have data loaded until Aug 11 2014.
If the chosen month is not complete (e.g. Aug 2014), then the MTD numbers should show only until Aug 11th and for the other months it should show the MTD numbers for the whole month.
The MTD expression I am using for the current month (Aug) is
RangeSum(above( sum({<Date={'=$(=max(Date))'},%Flag_ThisMonth={1} >}measure),0,rowno()))
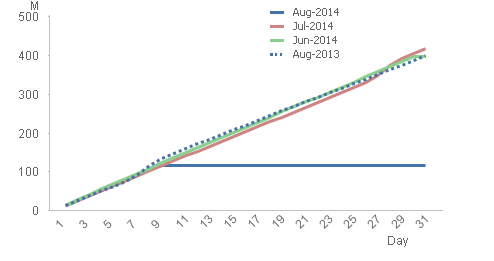
The problem am facing is that for the M-1 and M -2 it works fine, whereas for M i.e. Aug, the line extends until end of month with the same MTD value as of 13th Aug. I want the line to end on 13th August and not extend

Now if I remove the expressions for M-1, M-2 etc. then the above MTD expression for August works well.

Can anyone help me with this case ?
Would appreciate any help/pointers.
Thanks in advance.
- Mark as New
- Bookmark
- Subscribe
- Mute
- Subscribe to RSS Feed
- Permalink
- Report Inappropriate Content
I think you need a if-loop which checked the day from current month against the day from calendar. Maybe you could set these check within the background-color from the expression to change the color to transparency:
if(check, color(rowno()), argb(0,0,0,0))
- Marcus
- Mark as New
- Bookmark
- Subscribe
- Mute
- Subscribe to RSS Feed
- Permalink
- Report Inappropriate Content
Hello Macus,
That doesn't seem to do the trick, the check that I am making is this
if(month(max(Date)) <=month(Today()), color(rowno()), argb(0,0,0,0))
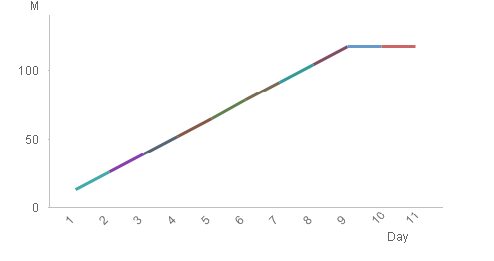
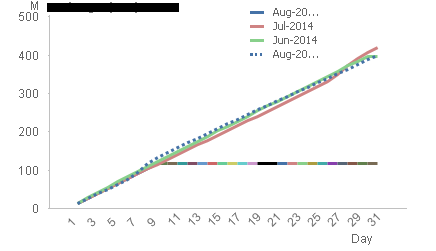
So now each month porition is colored differently for 2014 - am thinking this is because of the fact that the other expressions bring back data until end of day (31st) and this is causing it ?
- Mark as New
- Bookmark
- Subscribe
- Mute
- Subscribe to RSS Feed
- Permalink
- Report Inappropriate Content
Mustn't the expression check the day instead the month:
if(day(max(Date)) <=day(Today()), color(rowno()), argb(0,0,0,0))
- Marcus
- Mark as New
- Bookmark
- Subscribe
- Mute
- Subscribe to RSS Feed
- Permalink
- Report Inappropriate Content
Yes, you are right, but the one I tried was on YTD as I have the same problem in YTD chart (which shows month by month) . In both cases this doesn't seem to help ![]()

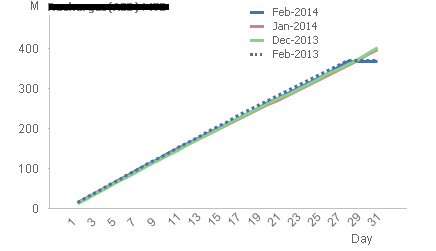
And more over, this assumes that I am always comparing against today. Looking at the case when the chosen month is March, it brings back the same number from Feb 28th to Feb 31st ![]()

Is it because I have Day as Dimension and this is until 31st - its extending the rangesum until that day ?
Thanks,
- Mark as New
- Bookmark
- Subscribe
- Mute
- Subscribe to RSS Feed
- Permalink
- Report Inappropriate Content
Yes it seems that to change the color didn't worked properly but if you set these condition in the expression it should work:
if(day(max(Date)) <=day(Today()), YourExpression, null())
- Marcus
- Mark as New
- Bookmark
- Subscribe
- Mute
- Subscribe to RSS Feed
- Permalink
- Report Inappropriate Content
Hi,
Sorry for the delay in responding to your DM
As its using Day# as the dimension and the calculation is cumulative its continuing (flat line) within the chart.
My first solution to try would be what Marcus suggested. This should stop the calculation in its tracks.
If this isn't working I'll see if I can replicate it and come back to you with another solution.
Richard