Unlock a world of possibilities! Login now and discover the exclusive benefits awaiting you.
- Qlik Community
- :
- All Forums
- :
- QlikView App Dev
- :
- Re: Monthly Average Calculation
- Subscribe to RSS Feed
- Mark Topic as New
- Mark Topic as Read
- Float this Topic for Current User
- Bookmark
- Subscribe
- Mute
- Printer Friendly Page
- Mark as New
- Bookmark
- Subscribe
- Mute
- Subscribe to RSS Feed
- Permalink
- Report Inappropriate Content
Monthly Average Calculation
Trying to create a KPI that compares 2016 numbers to 2017 numbers. Since we aren't halfway through 2017, I want to normalize the data so I can see an apples to apples comparison between the two years.
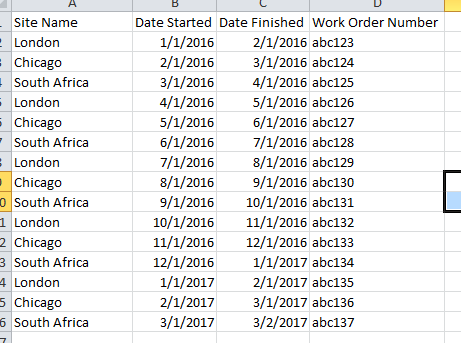
The KPI is to reduce work orders by 5% in 2017 compared to 2016. Here is what my data looks like (Not my real data but you get the picture, work order # is a unique ID)
My first goal is to look at the number of work orders, on average, by month, in 2016, and then do the same for 2017, and then do a year to year comparison.
So we might have started 1200 work orders in 2016 (Average of 100 per month), and we have only started 300 work orders in 2017 (average of 75 per month for the Jan-April numbers). So this should display as a reduction of 25%, or a -25%, since we went from 100/mo to 75/mo.
I can't seem to figure out how to do monthly average by year though. The avg function doesn't seem to work as my values aren't numeric. I could add a column in my data with a numeric value of 1 to everything, but I would prefer not to have to do this.
Thanks
- Mark as New
- Bookmark
- Subscribe
- Mute
- Subscribe to RSS Feed
- Permalink
- Report Inappropriate Content
Like you mentioned that your data has no numeric number, where did 1200 come from?
- Mark as New
- Bookmark
- Subscribe
- Mute
- Subscribe to RSS Feed
- Permalink
- Report Inappropriate Content
I can create a pivot table with a count of the work orders, and using a date.month dimension will show me how many work orders there were for the entire year. It's not 1200 exactly, I was just using round numbers for an example.
- Mark as New
- Bookmark
- Subscribe
- Mute
- Subscribe to RSS Feed
- Permalink
- Report Inappropriate Content
Establish a master Calendar with all required attributes of the date such as YTD, Previous YTD
This may help you