Unlock a world of possibilities! Login now and discover the exclusive benefits awaiting you.
- Qlik Community
- :
- All Forums
- :
- QlikView App Dev
- :
- Re: Months with zero values not being shown in the...
- Subscribe to RSS Feed
- Mark Topic as New
- Mark Topic as Read
- Float this Topic for Current User
- Bookmark
- Subscribe
- Mute
- Printer Friendly Page
- Mark as New
- Bookmark
- Subscribe
- Mute
- Subscribe to RSS Feed
- Permalink
- Report Inappropriate Content
Months with zero values not being shown in the chart
I have used canonical calendar script given in the link pasted in this blog as suggested by Rob.
I need to show missing months in the SLA resolution achievement.
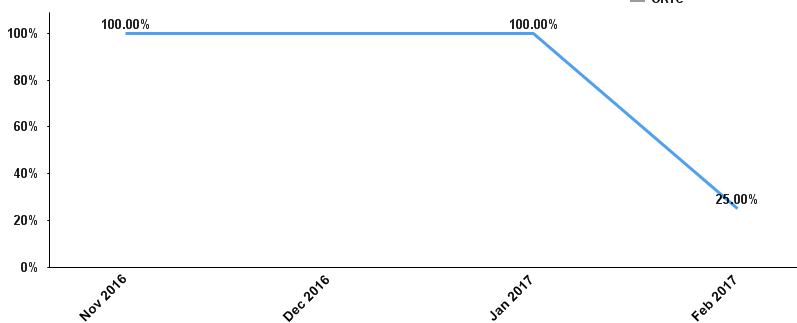
I am getting a graph such as the one pasted. It merely skips Dec where there are nil resolved tickets. It needs to touch zero for Dec 2016. I have unchecked Suppress Missing and Suppress Zero-Values in the Presentation tab.
I am using the expression as
count(DISTINCT{<SLA_INDICATOR={'SLA_MET'},DateType={'Resolved','Resolved_RTC','Resolved_Regulatory_Static_2016'},[Referred to CPS]={'Y'}>}[TR #])
/
count(DISTINCT{<SLA_INDICATOR={'SLA_MET','SLA_NOT_MET'},DateType={'Resolved','Resolved_RTC','Resolved_Regulatory_Static_2016'},[Referred to CPS]={'Y'}>}[TR #])
Please can you suggest a workaround that I can do for it or do i need to change the calendar script?
- Mark as New
- Bookmark
- Subscribe
- Mute
- Subscribe to RSS Feed
- Permalink
- Report Inappropriate Content
Hi,
Chart properties->Presentation:
Disable: Supress Zero-Values
- Mark as New
- Bookmark
- Subscribe
- Mute
- Subscribe to RSS Feed
- Permalink
- Report Inappropriate Content
As mentioned in my query i have already disabled it
- Mark as New
- Bookmark
- Subscribe
- Mute
- Subscribe to RSS Feed
- Permalink
- Report Inappropriate Content
May be try adding a Avg({1} 0) at the end and see if that helps
(Count(DISTINCT{<SLA_INDICATOR={'SLA_MET'},DateType={'Resolved','Resolved_RTC','Resolved_Regulatory_Static_2016'},[Referred to CPS]={'Y'}>}[TR #])
/
Count(DISTINCT{<SLA_INDICATOR={'SLA_MET','SLA_NOT_MET'},DateType={'Resolved','Resolved_RTC','Resolved_Regulatory_Static_2016'},[Referred to CPS]={'Y'}>}[TR #])) + Avg({1}0)
- Mark as New
- Bookmark
- Subscribe
- Mute
- Subscribe to RSS Feed
- Permalink
- Report Inappropriate Content
when i used the above expression it gave me

- Mark as New
- Bookmark
- Subscribe
- Mute
- Subscribe to RSS Feed
- Permalink
- Report Inappropriate Content
Is the images shrunk or did you take a partial screenshot this time? It might be easier if we can have a look at your app if you can possibly share it with us.