Unlock a world of possibilities! Login now and discover the exclusive benefits awaiting you.
- Qlik Community
- :
- All Forums
- :
- QlikView
- :
- Moving Annual Total Scripting
- Subscribe to RSS Feed
- Mark Topic as New
- Mark Topic as Read
- Float this Topic for Current User
- Bookmark
- Subscribe
- Mute
- Printer Friendly Page
- Mark as New
- Bookmark
- Subscribe
- Mute
- Subscribe to RSS Feed
- Permalink
- Report Inappropriate Content
Moving Annual Total Scripting
I have a variable vSetRolling12 which calculates rolling 12 months or Moving Annual Total (MAT) based on user date selections and this has the rolling expression:
PeriodID = {">=$(=Max(PeriodID) - 11)<=$(=Max(PeriodID))"},
Year = ,
Quarter = ,
Period = ,
Month =
I then use the variable to calculate a sum in my Qlikview document as follows:
=Sum ({$<$(vSetRolling12)>} [MedAid Amount] + [Shortfall])
which gives the following chart:
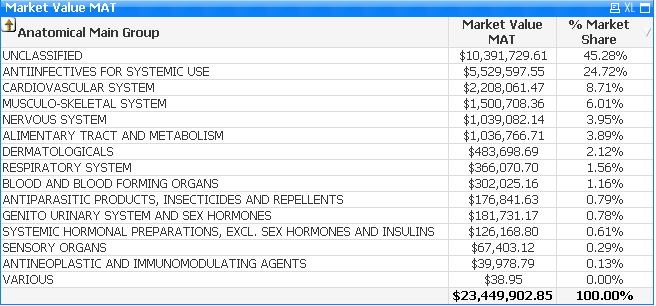
So user can select a month and year to give the applicable values for the moving annual total.
i now need to convert this to a static MAT so that i can have a chart for say Dec-2013 MAT and Dec-2014 MAT. i have adjusted my expression as follows:
=Sum ({$<$(vSetRolling12), [MonthYear] = {'Dec-2014'}>} [MedAid Amount] + [Shortfall])
The above gives the following results:
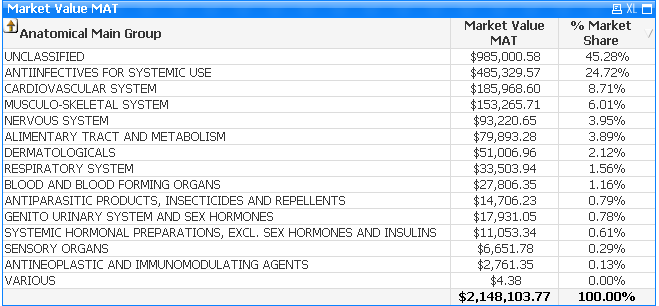
The results above are erroneous as this is not a MAT but a value for one month.
Where am i getting it wrong and how can this be rectified?
Thanking you in advance.
Regards.
Chris
- Tags:
- scripting
- Mark as New
- Bookmark
- Subscribe
- Mute
- Subscribe to RSS Feed
- Permalink
- Report Inappropriate Content
The [MonthYear] = {'Dec-2014'} in your Set Analysis is selecting only that month.
You need to do it so that it is >= the oldest date you want and <= the latest date you want.
- Mark as New
- Bookmark
- Subscribe
- Mute
- Subscribe to RSS Feed
- Permalink
- Report Inappropriate Content
Bill
Thank you very much for your input. I am a Newbie to QlikView and i am not sure how to implement your recommendation.
Regards
- Mark as New
- Bookmark
- Subscribe
- Mute
- Subscribe to RSS Feed
- Permalink
- Report Inappropriate Content
Hi Bill
I think i now have an idea.
I have used the following general expression to test my expressions:
=Num((Sum({< DateDispensed = {'>=$(=AddMonths('2015-09-30', -12))<=$(=Date('2015-08-31'))'} >} [MedAid Amount] + [Shortfall])), '$##,##0.00')
which gives the result below:

To check whether this is correct i used the following set analysis:
=Num((Sum ({$<$(vSetRolling12)>} [MedAid Amount] + [Shortfall])), '$##,##0.00')
where vSetRolling12 variable is:
PeriodID = {">=$(=Max(PeriodID) - 11)<=$(=Max(PeriodID))"},
Year = ,
Quarter = ,
Period = ,
Month =
which gives the following result when i select '2015' as the year and 'Aug' as the month from my calendar:

The results are different, what could be the cause for this?
Thanking you.
- Mark as New
- Bookmark
- Subscribe
- Mute
- Subscribe to RSS Feed
- Permalink
- Report Inappropriate Content
Hi all,
I have come across a solution, in order to provide a good moving annual total (MAT) analysis. The solution is called As-Of table. A very good example is provided here by Henric Conström:
Additionally, by using DateDiff (difference between the two dates), you might create different flags for flagging current 3months, 6months, 1Year, Ytd, etc.
Regards,
Oktay