Unlock a world of possibilities! Login now and discover the exclusive benefits awaiting you.
- Qlik Community
- :
- All Forums
- :
- QlikView App Dev
- :
- Re: Multiple calendar and aggregation problem
- Subscribe to RSS Feed
- Mark Topic as New
- Mark Topic as Read
- Float this Topic for Current User
- Bookmark
- Subscribe
- Mute
- Printer Friendly Page
- Mark as New
- Bookmark
- Subscribe
- Mute
- Subscribe to RSS Feed
- Permalink
- Report Inappropriate Content
Multiple calendar and aggregation problem
Hi all,
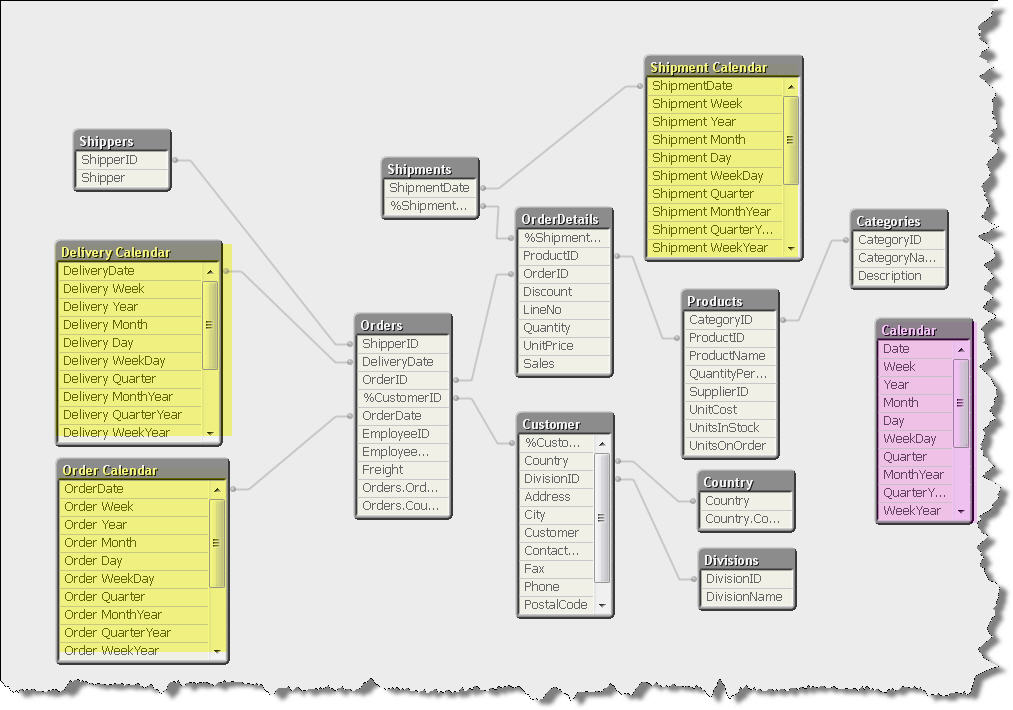
I am sure this is a common problem - let me explain. In the diagram below you can see that I am using 3 separate calendars one each for Deliveries, Orders and Shipments.

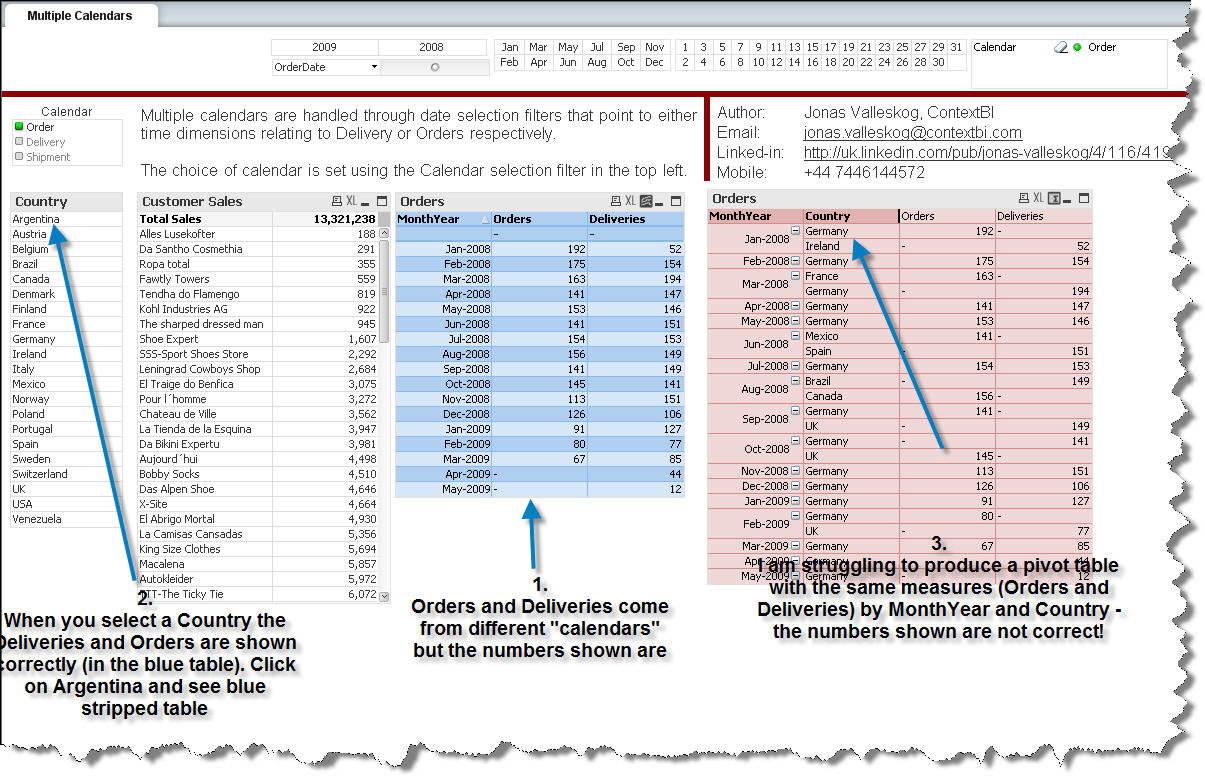
In the "blue" table (below) I am combining "Orders" (from the Order Calendar) and "Deliveries" from the "Delivery Calendar" (both shown in yellow) using the Dimension "Month Year" from an unconnected calendar called "Calendar" (shown in pink above) and then using syntax of the type:
aggr(
if(MonthYear = [Order MonthYear],
sum(Orders.Counter)
) ,MonthYear ,[Order MonthYear]) for "Orders" and
aggr(
if(MonthYear = [Delivery MonthYear],
sum(Orders.Counter)
) ,MonthYear ,[Delivery MonthYear]) for "Deliveries"

So far so good - all works fine and the numbers are correct.
Choosing a "Country" from the list box yields the correct results in the blue table.
My requirement, however, is to extend the "blue" table to show Orders and Deliveries for each country for every month (see pink table above). The resultant pivot table is incorrect - any help would be most appreciated. I attach the above demo application with data.
Best regards
Alexis
Accepted Solutions
- Mark as New
- Bookmark
- Subscribe
- Mute
- Subscribe to RSS Feed
- Permalink
- Report Inappropriate Content
- Mark as New
- Bookmark
- Subscribe
- Mute
- Subscribe to RSS Feed
- Permalink
- Report Inappropriate Content
Hi ,
Can you check the attached qvw hope this solves your problem
- Mark as New
- Bookmark
- Subscribe
- Mute
- Subscribe to RSS Feed
- Permalink
- Report Inappropriate Content
As simple as that - and here was me looking for a more complex solution.
Thank you very much Bhagirath.
Best regards
Alexis
- Mark as New
- Bookmark
- Subscribe
- Mute
- Subscribe to RSS Feed
- Permalink
- Report Inappropriate Content
that's because your aggr function was running on only one dimension and in chart you were looking for data with respect to both the dimensions..
Good to know that this solves your problem...
Cheers...!!!
Bhagirath