Unlock a world of possibilities! Login now and discover the exclusive benefits awaiting you.
- Qlik Community
- :
- All Forums
- :
- QlikView App Dev
- :
- Re: NPrinting, Excel and Chart objects not showing...
- Subscribe to RSS Feed
- Mark Topic as New
- Mark Topic as Read
- Float this Topic for Current User
- Bookmark
- Subscribe
- Mute
- Printer Friendly Page
- Mark as New
- Bookmark
- Subscribe
- Mute
- Subscribe to RSS Feed
- Permalink
- Report Inappropriate Content
NPrinting, Excel and Chart objects not showing all data
So. I'm using NPrinting to import a small table into Excel from which i want to build a pie chart.
I start new template and import the table object.then drag on a dimension and a measure.
I select the dimension and measure then using the excel function I insert pie chart.
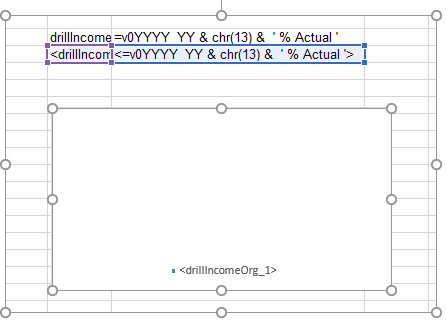
And this is what I get...

As you can see it only links the one row. If I manually change the pie chart data selection to the whole set in the preview then it works as expected.
Now I’ve seen examples in various places that say I need to select the row with the data and the empty row beneath it but that then only links the first and then last empty row - never the rows in between.
I must be doing something very obviously wrong here as it can't be that hard.
Any clues?
Accepted Solutions
- Mark as New
- Bookmark
- Subscribe
- Mute
- Subscribe to RSS Feed
- Permalink
- Report Inappropriate Content
Hi Wallo.
Thanks, that may have fixed it however I found that a better way to handle charting was to base a pivot chart upon my table data and then further base whatever chart I wanted to use on that pivot.
- Mark as New
- Bookmark
- Subscribe
- Mute
- Subscribe to RSS Feed
- Permalink
- Report Inappropriate Content
You have to enter the chart data as a level in Nprinting so that is selects all the data.
- Mark as New
- Bookmark
- Subscribe
- Mute
- Subscribe to RSS Feed
- Permalink
- Report Inappropriate Content
Hi Wallo.
Thanks, that may have fixed it however I found that a better way to handle charting was to base a pivot chart upon my table data and then further base whatever chart I wanted to use on that pivot.
- Mark as New
- Bookmark
- Subscribe
- Mute
- Subscribe to RSS Feed
- Permalink
- Report Inappropriate Content
Glad you got something that works. But how are you keeping the data source range of the pivot table updated?
- Mark as New
- Bookmark
- Subscribe
- Mute
- Subscribe to RSS Feed
- Permalink
- Report Inappropriate Content
As long as the row beneath the first data table is included in the range, the pivot table automatically captures the full set. It all works so much better basing charts on pivots rather than directly on the data table.
- Mark as New
- Bookmark
- Subscribe
- Mute
- Subscribe to RSS Feed
- Permalink
- Report Inappropriate Content
Good deal. Please mark an answer correct, even if it's your own.