Unlock a world of possibilities! Login now and discover the exclusive benefits awaiting you.
- Qlik Community
- :
- All Forums
- :
- QlikView App Dev
- :
- Re: Need Help In set Analysis for MAx Value
- Subscribe to RSS Feed
- Mark Topic as New
- Mark Topic as Read
- Float this Topic for Current User
- Bookmark
- Subscribe
- Mute
- Printer Friendly Page
- Mark as New
- Bookmark
- Subscribe
- Mute
- Subscribe to RSS Feed
- Permalink
- Report Inappropriate Content
Need Help In set Analysis for MAx Value
Hello! I need help in my set analysis in my pivot table to get the max value...get the latest award Award Value based on Max date by FY, FQ and Company even if the Qty is 0
Here is my sample data
| Date | Company | FY | FQ | Award | Qty |
| 10/26/2014 | A | 2015 | Q1 | 15 | 15 |
| 10/27/2014 | A | 2015 | Q1 | 15 | 200 |
| 10/28/2014 | A | 2015 | Q1 | 30 | 300 |
| 10/29/2014 | A | 2015 | Q1 | 30 | 400 |
| 10/30/2014 | A | 2015 | Q1 | 30 | 0 |
| 10/26/2014 | B | 2015 | Q1 | 20 | 400 |
| 10/27/2014 | B | 2015 | Q1 | 15 | 500 |
| 10/28/2014 | B | 2015 | Q1 | 20 | 600 |
| 10/29/2014 | B | 2015 | Q1 | 45 | 200 |
| 10/30/2014 | B | 2015 | Q1 | 20 | 20 |
| 1/25/2014 | A | 2015 | Q2 | 15 | 50 |
| 1/26/2014 | A | 2015 | Q2 | 30 | 100 |
| 1/27/2014 | A | 2015 | Q2 | 20 | 30 |
| 1/28/2014 | A | 2015 | Q2 | 30 | 20 |
| 1/29/2014 | A | 2015 | Q2 | 80 | 0 |
| 1/30/2014 | B | 2015 | Q2 | 15 | 400 |
| 1/31/2014 | B | 2015 | Q2 | 30 | 500 |
| 2/1/2014 | B | 2015 | Q2 | 20 | 600 |
| 1/25/2014 | B | 2015 | Q2 | 20 | 200 |
| 1/26/2014 | B | 2015 | Q2 | 10 | 20 |
I tries using the formula but doesn't work...When I select FY2015 Q4, only the row with more than 0 qty will show up...I want all awards to show up even if its 0 qty...
=only({<FY=,FQ=,Company=,Qty=,Date={"$(=MaxString(Date))"}>}Award)
This is my desired results :
| Date | Company | FY | FQ | Award |
| 10/30/2014 | A | 2015 | Q1 | 30 |
| 10/30/2014 | B | 2015 | Q1 | 20 |
| 1/29/2014 | A | 2015 | Q2 | 80 |
| 1/26/2014 | B | 2015 | Q2 | 10 |
I hope you can help me on this ...
Tks.
- « Previous Replies
-
- 1
- 2
- Next Replies »
- Mark as New
- Bookmark
- Subscribe
- Mute
- Subscribe to RSS Feed
- Permalink
- Report Inappropriate Content
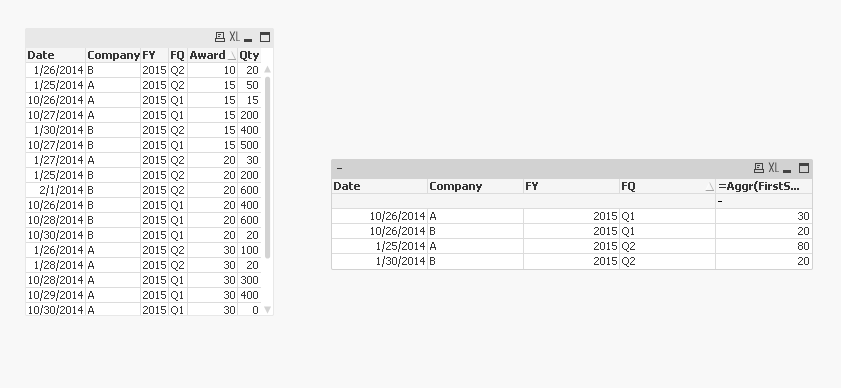
Try this expression: =Aggr(FirstSortedValue(Award, -Date), Company, FQ)
Dimension: Date, Company, FY, FQ
Output:
- Mark as New
- Bookmark
- Subscribe
- Mute
- Subscribe to RSS Feed
- Permalink
- Report Inappropriate Content
Newer version, disregard the previous post
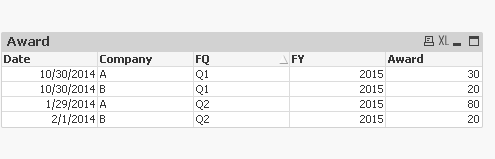
Expression1: =FirstSortedValue(Date, -Date)
Expression2: =FirstSortedValue(Award, -Date)
Dimensions: Company, FQ, FY
Attaching the qvw for reference.
Best,
Sunny
- Mark as New
- Bookmark
- Subscribe
- Mute
- Subscribe to RSS Feed
- Permalink
- Report Inappropriate Content
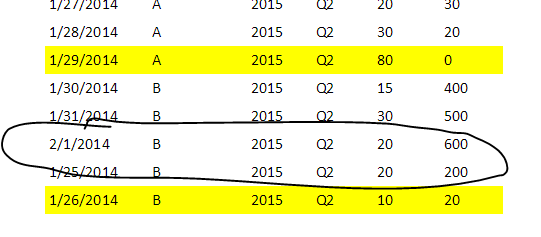
Also, just to make sure I am understanding it correct. In the below image the circled part is the one you want and not the yellowed part, right?
- Mark as New
- Bookmark
- Subscribe
- Mute
- Subscribe to RSS Feed
- Permalink
- Report Inappropriate Content
| Date | Company | FY | FQ | Award | Qty |
| 10/26/2014 | A | 2015 | Q1 | 15 | 15 |
| 10/27/2014 | A | 2015 | Q1 | 15 | 200 |
| 10/28/2014 | A | 2015 | Q1 | 30 | 300 |
| 10/29/2014 | A | 2015 | Q1 | 30 | 400 |
| 10/30/2014 | A | 2015 | Q1 | 30 | 200 |
| 10/26/2014 | B | 2015 | Q1 | 20 | 400 |
| 10/27/2014 | B | 2015 | Q1 | 15 | 500 |
| 10/28/2014 | B | 2015 | Q1 | 20 | 600 |
| 10/29/2014 | B | 2015 | Q1 | 45 | 200 |
| 10/30/2014 | B | 2015 | Q1 | 20 | 20 |
| 1/25/2014 | A | 2015 | Q2 | 15 | 50 |
| 1/26/2014 | A | 2015 | Q2 | 30 | 100 |
| 1/27/2014 | A | 2015 | Q2 | 20 | 30 |
| 1/28/2014 | A | 2015 | Q2 | 30 | 20 |
| 1/29/2014 | A | 2015 | Q2 | 80 | 0 |
| 1/25/2014 | B | 2015 | Q2 | 15 | 400 |
| 1/26/2014 | B | 2015 | Q2 | 30 | 500 |
| 1/27/2014 | B | 2015 | Q2 | 20 | 600 |
| 1/28/2014 | B | 2015 | Q2 | 20 | 200 |
| 1/29/2014 | B | 2015 | Q2 | 10 | 20 |
| Date | Company | FY | FQ | Award | Qty |
| 10/30/2014 | A | 2015 | Q1 | 30 | 200 |
| 10/30/2014 | B | 2015 | Q1 | 20 | 20 |
| 1/29/2014 | A | 2015 | Q2 | 80 | 0 |
| 1/29/2014 | B | 2015 | Q2 | 10 | 20 |
- Mark as New
- Bookmark
- Subscribe
- Mute
- Subscribe to RSS Feed
- Permalink
- Report Inappropriate Content
Output:
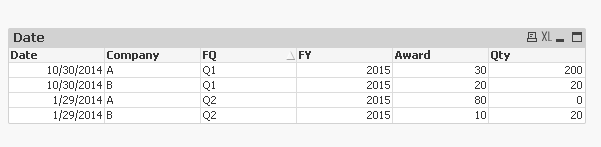
Expression1: =FirstSortedValue(Date, -Date)
Expression2: =FirstSortedValue(Award, -Date)
Expression3: =FirstSortedValue(Qty, -Date)
Dimensions: Company, FQ, FY
HTH
Best,
Sunny
- Mark as New
- Bookmark
- Subscribe
- Mute
- Subscribe to RSS Feed
- Permalink
- Report Inappropriate Content
Hi! This one looks better...However, I noticed for the 0 Qty , it creates a new row f "Unknown" Company...Is there anyway, to get rid of these?
Tks.
- Mark as New
- Bookmark
- Subscribe
- Mute
- Subscribe to RSS Feed
- Permalink
- Report Inappropriate Content
Hi! This one looks better...However, I noticed for the 0 Qty , it creates a new row f "Unknown" Company...Is there anyway, to get rid of these?
Not sure what you mean here?
- Mark as New
- Bookmark
- Subscribe
- Mute
- Subscribe to RSS Feed
- Permalink
- Report Inappropriate Content
Oh Ok...I have fixed the Unknown ...It's bec...I have added the first sorted value for Company... I took it out and its gone......But the Award for the 0 qty doesn't show up...Thus, only 1 row showed up (with more than 1 qty) for each quarter.
Tks.
- Mark as New
- Bookmark
- Subscribe
- Mute
- Subscribe to RSS Feed
- Permalink
- Report Inappropriate Content
So all is working now then?
- « Previous Replies
-
- 1
- 2
- Next Replies »