Unlock a world of possibilities! Login now and discover the exclusive benefits awaiting you.
- Qlik Community
- :
- All Forums
- :
- QlikView App Dev
- :
- Need Help with chart
- Subscribe to RSS Feed
- Mark Topic as New
- Mark Topic as Read
- Float this Topic for Current User
- Bookmark
- Subscribe
- Mute
- Printer Friendly Page
- Mark as New
- Bookmark
- Subscribe
- Mute
- Subscribe to RSS Feed
- Permalink
- Report Inappropriate Content
Need Help with chart
Hi Experts,
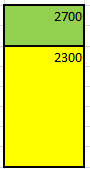
I want to make a bar chart like example below, using 2 expressions where one will give me an overall count and the other one a specific count which will be always lower than the overall count. Please help me in how i can solve it
Thanks in Advance,
Cristian.
- Mark as New
- Bookmark
- Subscribe
- Mute
- Subscribe to RSS Feed
- Permalink
- Report Inappropriate Content
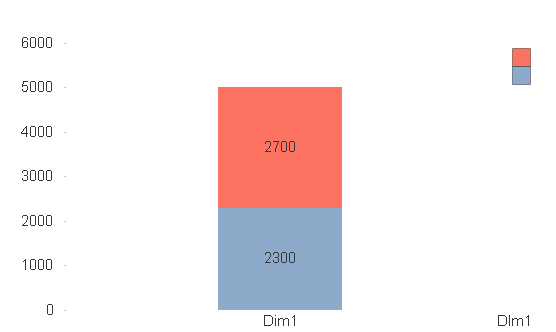
make a bar chart with 2 expressions (no dimensions) and
in style tab choose stacked
- Mark as New
- Bookmark
- Subscribe
- Mute
- Subscribe to RSS Feed
- Permalink
- Report Inappropriate Content
Thanks for your help, but that will give me the sum of those 2 expressions and what I want is one into another like in the example.
- Mark as New
- Bookmark
- Subscribe
- Mute
- Subscribe to RSS Feed
- Permalink
- Report Inappropriate Content
you just Need to define under tab peresentation
click on
Plot values inside Segment
- Mark as New
- Bookmark
- Subscribe
- Mute
- Subscribe to RSS Feed
- Permalink
- Report Inappropriate Content
I thinks he wants
2700 as sum of the 2 bar
2300 as lower bar
not
5000 as sum
2300 as lower
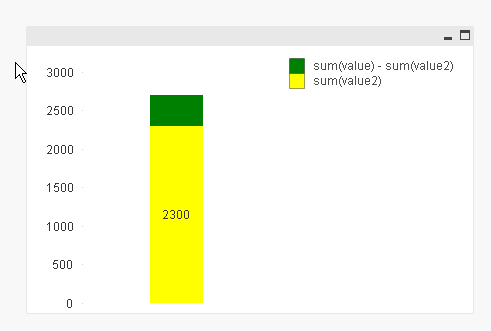
something like
sum(value2) 2300 yellow
sum(value) - sum(value2) 2700 - 2300 = 400 green
the problem is the value on data point for green bar
- Mark as New
- Bookmark
- Subscribe
- Mute
- Subscribe to RSS Feed
- Permalink
- Report Inappropriate Content
that's possible too, just ise the dual function
first Expression = sum(Val)
second Expression = dual(sum(ValComplet),sum(ValComplet-Val))

- Mark as New
- Bookmark
- Subscribe
- Mute
- Subscribe to RSS Feed
- Permalink
- Report Inappropriate Content
Hi Canzovino
Can you provide some sample data and attach the file to demonstrate your requirement?
- Mark as New
- Bookmark
- Subscribe
- Mute
- Subscribe to RSS Feed
- Permalink
- Report Inappropriate Content
Hi,
Try like this
For specific Count:
Count(DimensionName)
Overall Count:
=Count(TOTAL DimensionName) - Count(DimensionName)
Now select Stacked in Chart Properties -> Sytle -> Select Stacked
Hope this helps you.
Regards,
Jagan.