Unlock a world of possibilities! Login now and discover the exclusive benefits awaiting you.
- Qlik Community
- :
- All Forums
- :
- QlikView App Dev
- :
- Re: Need Help
- Subscribe to RSS Feed
- Mark Topic as New
- Mark Topic as Read
- Float this Topic for Current User
- Bookmark
- Subscribe
- Mute
- Printer Friendly Page
- Mark as New
- Bookmark
- Subscribe
- Mute
- Subscribe to RSS Feed
- Permalink
- Report Inappropriate Content
Need Help
HI Community,
I have one table like, I have three fields EmpID, Status and TempDate..
I want to compare with two Months, like 2 variables StartMonth and EndMonth..
Suppose if i am select May and June, status wise i have to show data how many changed records.....
| EmpID | Status | TempDate |
| 123 | InProgress | 5/27/2015 |
| 11 | Resolved | 5/27/2015 |
| 679 | Resolution Pending | 5/27/2015 |
| 678 | Opened | 6/27/2015 |
| 123 | Assigned Owner | 6/27/2015 |
| 11 | Resolution Pending | 6/27/2015 |
| 11 | Resolved | 6/29/2015 |
| 13 | InProgress | 6/29/2015 |
Example:
See one particular case..
| EmpID | Status | TempDate |
| 123 | InProgress | 5/27/2015 |
| 123 | Assigned Owner | 6/27/2015 |
Here particular ID wise changed status InProgress to Assigmed Owner..
I want to show like this......
- Tags:
- new_to_qlikview
- « Previous Replies
-
- 1
- 2
- Next Replies »
- Mark as New
- Bookmark
- Subscribe
- Mute
- Subscribe to RSS Feed
- Permalink
- Report Inappropriate Content
I have attached a sample ... Hope it helps.
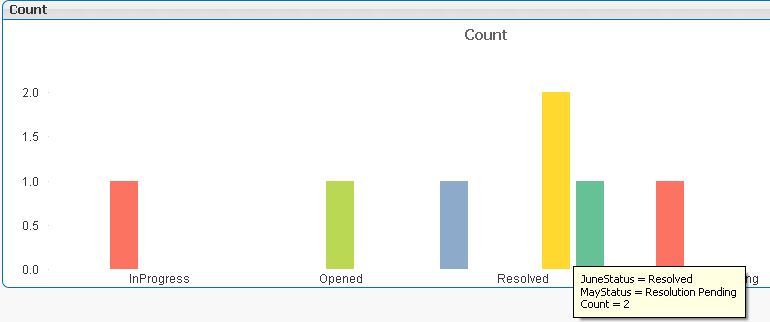
I have created a data island of dates and 2 variables which gets populated depending on the selection.
The chart is done using set analysis
- Mark as New
- Bookmark
- Subscribe
- Mute
- Subscribe to RSS Feed
- Permalink
- Report Inappropriate Content
Hi,
If you attach the sample file then it would be easier to understand your data and provide better solution.
Regards,
Jagan.
- Mark as New
- Bookmark
- Subscribe
- Mute
- Subscribe to RSS Feed
- Permalink
- Report Inappropriate Content
Cn u attach the sample file
Regards,
Mohammad
- Mark as New
- Bookmark
- Subscribe
- Mute
- Subscribe to RSS Feed
- Permalink
- Report Inappropriate Content
HI Jagan,
PFA,
- Mark as New
- Bookmark
- Subscribe
- Mute
- Subscribe to RSS Feed
- Permalink
- Report Inappropriate Content
Please anyone can help me...........
- Mark as New
- Bookmark
- Subscribe
- Mute
- Subscribe to RSS Feed
- Permalink
- Report Inappropriate Content
hi
why don't you concatenate both the tables with the following script
May:
LOAD ID,
Status as Status,
Date as date,
StartDate as StartDate,
Duedate as Duedate,
CreationDate as CreationDate,
'May' as Flag
FROM
(
Concatenate(May)
//June:
LOAD ID,
Status as Status,
Date as date,
StartDate as StartDate,
Duedate as Duedate,
CreationDate as CreationDate,
'June' as Flag
FROM
(
while concatenating the table I have added a static field called flag to separate the data
after loading the data create a bar chart chart with
dimension as Status
expression 1 as count({<Flag={'June'}>ID}
expression2 as Count({<Flag={'May'}>}ID)
- Mark as New
- Bookmark
- Subscribe
- Mute
- Subscribe to RSS Feed
- Permalink
- Report Inappropriate Content
Hi,
Please find attached file for solution.
Regards,
Jagan.
- Mark as New
- Bookmark
- Subscribe
- Mute
- Subscribe to RSS Feed
- Permalink
- Report Inappropriate Content
Hi Jagan,
But i want change based on selection,
i have all months data, if i am click Feb and Sep..
i want to compare with data based on status changed count....
I have attached sample data in that i have only 2 months May and June....
but i have all months data....
- Mark as New
- Bookmark
- Subscribe
- Mute
- Subscribe to RSS Feed
- Permalink
- Report Inappropriate Content
Hi,
Change the months dynamically by passing the variables. If you attach sample for all the months then it would be easier to provide the solution.
Regards,
Jagan.
- « Previous Replies
-
- 1
- 2
- Next Replies »