Unlock a world of possibilities! Login now and discover the exclusive benefits awaiting you.
- Qlik Community
- :
- All Forums
- :
- QlikView App Dev
- :
- Re: Need Help
- Subscribe to RSS Feed
- Mark Topic as New
- Mark Topic as Read
- Float this Topic for Current User
- Bookmark
- Subscribe
- Mute
- Printer Friendly Page
- Mark as New
- Bookmark
- Subscribe
- Mute
- Subscribe to RSS Feed
- Permalink
- Report Inappropriate Content
Need Help
HI Community,
I am facing issue with Stacked Gantt Chart..
I have three dates like
StartDate EndDate PostDate
| 15-Jul-2015 | 01-Jun-2016 | 01-Feb-2017 |
| 01-Jun-2016 | 01-Feb-2018 | |
| 14-Dec-2015 | 01-Jun-2016 | 01-Feb-2018 |
I have 2 Expressions, one is Max(EndDate)-Min(StartDate)
1st Expression showing Correct------> if i have any null value in StartDate i have to show Symbol, its working..
If i am click Symbol, it showing another format... i have to show only years..
and another one is Max(PostDate)-Min(EndDate)
2nd Expression not working, it should show bar..
PFA,
Thanks in Advance...
- Tags:
- new_to_qlikview
- « Previous Replies
-
- 1
- 2
- Next Replies »
- Mark as New
- Bookmark
- Subscribe
- Mute
- Subscribe to RSS Feed
- Permalink
- Report Inappropriate Content
Hi,
If i am using Invisible option, every bar starting from 2016,
My chart should be like..
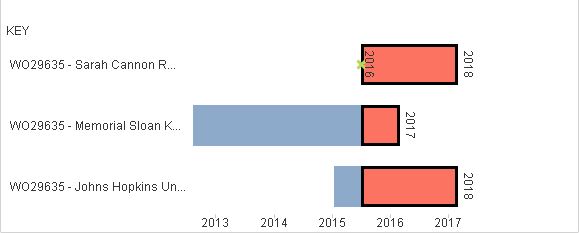
because my data start from date 2013 year also....
- Mark as New
- Bookmark
- Subscribe
- Mute
- Subscribe to RSS Feed
- Permalink
- Report Inappropriate Content
HI,
Please anyone can help me????
- « Previous Replies
-
- 1
- 2
- Next Replies »