Unlock a world of possibilities! Login now and discover the exclusive benefits awaiting you.
- Qlik Community
- :
- All Forums
- :
- QlikView App Dev
- :
- Need Help
- Subscribe to RSS Feed
- Mark Topic as New
- Mark Topic as Read
- Float this Topic for Current User
- Bookmark
- Subscribe
- Mute
- Printer Friendly Page
- Mark as New
- Bookmark
- Subscribe
- Mute
- Subscribe to RSS Feed
- Permalink
- Report Inappropriate Content
Need Help
HI Community,
I have one scenario,
I have one table like,
LOAD ID,
Status,
Date,
Date(Date,'MMM-YY') as MonthYear ,
Duedate,
Date(Duedate,'MMM-YY') as DDMonthYear
FROM
(ooxml, embedded labels, table is Sheet3);
I want to show in Bar Chart....
MonthYear wise Satus for Date and DueDate Count
Thanks in Advance....
- Tags:
- new_to_qlikview
- Mark as New
- Bookmark
- Subscribe
- Mute
- Subscribe to RSS Feed
- Permalink
- Report Inappropriate Content
Hi Paul
To calculate your MonthYear use the following:
Date(MonthStart(Date),'MMM-YYYY') as MonthYear,
Date(MonthStart(DueDate),'MMM-YYYY') as DDMonthYear
(The 'Date' within the MonthStart parenthesis is the name of your date field whereas the 'Date' at the start of the line is the QV function.)
so your script would become:
LOAD ID,
Status,
Date,
Date(MonthStart(Date),'MMM-YYYY') as MonthYear ,
Duedate,
Date(MonthStart(DueDate),'MMM-YYYY') as DDMonthYear
FROM
(ooxml, embedded labels, table is Sheet3);
You can then use MonthYear or DDMonthYear as a dimension in your Bar Chart.
You could also set up a cyclic or drill down group to include MonthYear and DDMonthYear where you could use the group as the Dimension and then be able to switch between MonthYear or DDMonthYear in the same chart.
You can access the groups option at
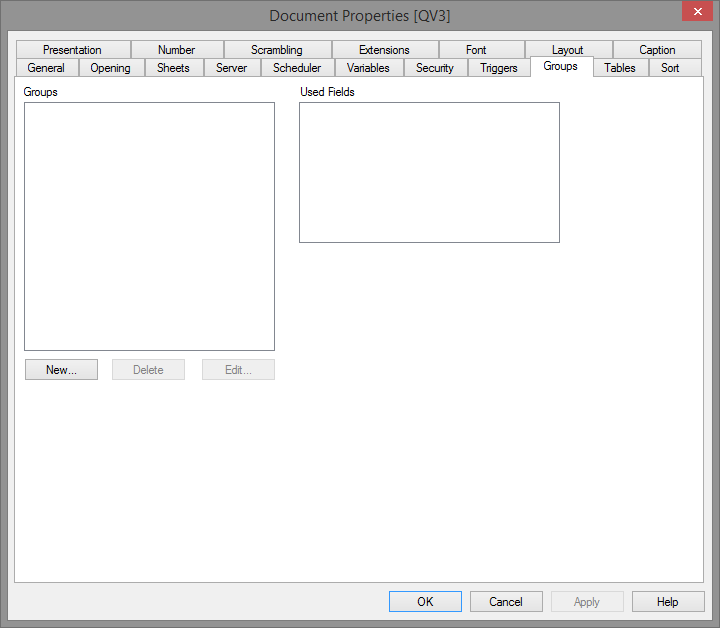
Hope that helps.
Kind regards
Steve
- Mark as New
- Bookmark
- Subscribe
- Mute
- Subscribe to RSS Feed
- Permalink
- Report Inappropriate Content
I want to show staked bar's..
dimension i want to create dynamically and i need to show Count(Duedate status) and Count(Date status).
Please anyone can help me....
Like...
- Mark as New
- Bookmark
- Subscribe
- Mute
- Subscribe to RSS Feed
- Permalink
- Report Inappropriate Content
Please anyone faced this type of issue...
and i want to restrict only current Monthyear data only..
by default i want to show Like(Jan-15,Feb-15,Apr-15,May-15,Jun-15,Jul-15,Aug-15,Sep-15,Oct-15,Nov-15,Dec-15)
i dont want to show (Jan16,feb16 and so on), if i am click 2016 i want to show.....
- Mark as New
- Bookmark
- Subscribe
- Mute
- Subscribe to RSS Feed
- Permalink
- Report Inappropriate Content
Hi,
Try like
In expression.
Count({<Date={"<$(=max(Date))"},MonthYear=>}Duedate status)
Regards
Please appreciate our Qlik community members by giving Kudos for sharing their time for your query. If your query is answered, please mark the topic as resolved 🙂
- Mark as New
- Bookmark
- Subscribe
- Mute
- Subscribe to RSS Feed
- Permalink
- Report Inappropriate Content
Hi Max,
I thought i have simple query...
i have one calculate dimension
(Like(Month-Year)Jan-15,Feb-15,Apr-15,May-15,Jun-15,Jul-15,Aug-15,Sep-15,Oct-15,Nov-15,Dec-15)
and i have 2 date fields......1. Date 2. DueDate
i want to calculate date wise status(Status i have field)
1. Date wise Count(status)
2. Duedate wise Count(status)
i want to compare status Count Date wise and DueDate wise.
- Mark as New
- Bookmark
- Subscribe
- Mute
- Subscribe to RSS Feed
- Permalink
- Report Inappropriate Content
Hi Paul
I think I understand what you want now. If I have understood correctly you have a data set that contains a number of date status entries and a number of due date status entries and you wish to create a stacked bar chart based on MonthYear where you can see the count of each type of status for each MonthYear period.
If that is correct then I believe you are looking for a result like this:
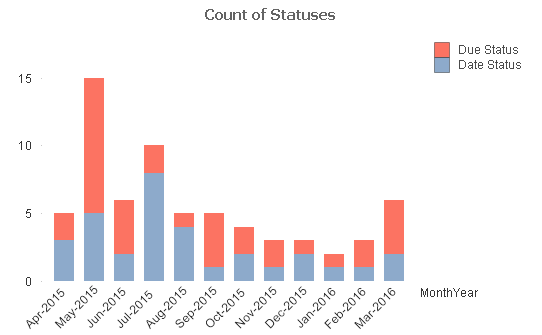
The key to achieving this is to load your data in two steps and tag the data so you can use set analysis in your expressions to pick out the particular type of data you wish to show.
I will call your 'Date' field 'CAL_Date' just for clarity to avoid confusion with the Date function.
So the load script is:
StatusData:
LOAD
Date(CAL_Date,'MMM-YYYY') AS MonthYear,
'StatusDate' as DateType,
Status
FROM
[Statuses.xlsx]
(ooxml, embedded labels, table is StatusDates);
Concatenate (StatusData)
Load
Date(CAL_Date,'MMM-YYYY') as MonthYear,
'DueDate' as DateType,
Status
FROM
[Statuses.xlsx]
(ooxml, embedded labels, table is DueDates);
In the above script I firstly loaded the set of status data using your 'Date' as the MonthYear and tagging these values with a type of 'StatusDate'. Secondly I concatenated the Due Date data but tagged these with a type of 'DueDate'.
This means that in memory I actually now have one big table containing all the data but each row is differentiated by the type of date represented in the row.
Moving to the bar chart I can then use MonthYear as the dimension and then create two expressions using set analysis.
For the 'Due Status' expression the formula is: Count ({$<DateType={'DueDate'}>}Status)
For the 'Date Status' expression the formula is: Count ({$<DateType={'StatusDate'}>}Status)
The result is the above chart which I believe is what you are trying to achieve.
Hope that helps.
Kind regards
Steve