Unlock a world of possibilities! Login now and discover the exclusive benefits awaiting you.
- Qlik Community
- :
- All Forums
- :
- QlikView App Dev
- :
- Re: Need a Qlikview Help in creating a Delta Data ...
- Subscribe to RSS Feed
- Mark Topic as New
- Mark Topic as Read
- Float this Topic for Current User
- Bookmark
- Subscribe
- Mute
- Printer Friendly Page
- Mark as New
- Bookmark
- Subscribe
- Mute
- Subscribe to RSS Feed
- Permalink
- Report Inappropriate Content
Need a Qlikview Help in creating a Delta Data Set !!!
Hi All,
I am facing a problem while creating a Delta report in the Front End.
There are two data sets in the UI Table Boxes.
A. Without Any Filters (Table Box)
B. With All Filters Selected (Table Box)
I need to Create a Delta Report ( Data Set A - Data Set B)
The below are Data Sets.
| Data Set A | ||
| DATE | EMP NO | Product |
| 3/28/2015 | X12345 | A |
| 4/29/2015 | B1234 | B |
| 3/29/2016 | Y32567 | C |
| 7/30/2016 | N3456 | A |
| 3/30/2017 | B45389 | D |
| 1/31/2017 | L3421 | E |
| 3/31/2018 | A89012 | N |
| Date Set B | ||
| DATE | EMP NO | Product |
| 3/28/2015 | X12345 | A |
| 3/29/2016 | Y32567 | C |
| 3/30/2017 | B45389 | D |
| 3/31/2018 | A89012 | N |
| Delta (A - B) --- Expected | ||
| DATE | EMP NO | Product |
| 4/29/2015 | B1234 | B |
| 7/30/2016 | N3456 | A |
| 1/31/2017 | L3421 | E |
Note these are Direct Fields from Data Model i.e. No Aggregations like Sum() or Max()
Filters are
Quarters
Month
Year
Any Inputs would be Helpful...............
- Tags:
- new_to_qlikview
- Mark as New
- Bookmark
- Subscribe
- Mute
- Subscribe to RSS Feed
- Permalink
- Report Inappropriate Content
Try this:
Dataset1:
LOAD *,
DATE&[EMP NO]&Product as Check1;
LOAD * Inline [
DATE, EMP NO, Product
3/28/2015, X12345, A
4/29/2015, B1234, B
3/29/2016, Y32567, C
7/30/2016, N3456, A
3/30/2017, B45389, D
1/31/2017, L3421, E
3/31/2018, A89012, N
];
Dataset2:
NoConcatenate
LOAD *,
DATE&[EMP NO]&Product as Check2;
LOAD * Inline [
DATE, EMP NO, Product
3/28/2015, X12345, A
3/29/2016, Y32567, C
3/30/2017, B45389, D
3/31/2018, A89012, N
];
[Set1-Set2]:
NoConcatenate
LOAD *
Resident Dataset1
Where not Exists(Check2, Check1);
DROP Tables Dataset1, Dataset2;
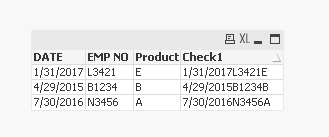
Output:
- Mark as New
- Bookmark
- Subscribe
- Mute
- Subscribe to RSS Feed
- Permalink
- Report Inappropriate Content
Here is a front end solution where Script is just the two tables:
Dataset1:
LOAD * Inline [
DATE, EMP NO, Product
3/28/2015, X12345, A
4/29/2015, B1234, B
3/29/2016, Y32567, C
7/30/2016, N3456, A
3/30/2017, B45389, D
1/31/2017, L3421, E
3/31/2018, A89012, N
];
Dataset2:
LOAD * Inline [
DATE, EMP NO, Product
3/28/2015, X12345, A
3/29/2016, Y32567, C
3/30/2017, B45389, D
3/31/2018, A89012, N
];
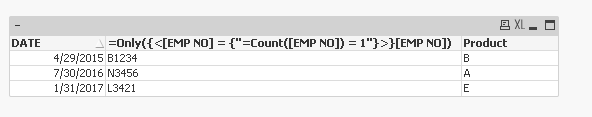
Chart's Dimension: DATE, Product
Chart's Expression: =Only({<[EMP NO] = {"=Count([EMP NO]) = 1"}>}[EMP NO])
Output:
- Mark as New
- Bookmark
- Subscribe
- Mute
- Subscribe to RSS Feed
- Permalink
- Report Inappropriate Content
Hi Sunny,
The Data set is the Front End Table Box which i mentioned, which is coming from Data model.
I cannot use the where exists clause, because this is the same table.
Data Set B:- With Filters in Front End
Data Set A:- Without any filters.
Expected A - B
- Mark as New
- Bookmark
- Subscribe
- Mute
- Subscribe to RSS Feed
- Permalink
- Report Inappropriate Content
May be you need this in the set analysis
{1-$}
- Mark as New
- Bookmark
- Subscribe
- Mute
- Subscribe to RSS Feed
- Permalink
- Report Inappropriate Content
Can you give me in details please..?
Because, there is no aggregation.
This is no Chart, its a table Box, Even if i create a ST table Chart, Don't know to proceed.
Hope you got my point.
- Mark as New
- Bookmark
- Subscribe
- Mute
- Subscribe to RSS Feed
- Permalink
- Report Inappropriate Content
I don't think there is any way to do this in a table box, but you may be able to manipulate a straight table to behave like a table box. Would you be able to share a more representative data where I can make selections in Quarter, Month, Year Fields and may be help you achieve the result (via Straight table).
Best,
Sunny