Unlock a world of possibilities! Login now and discover the exclusive benefits awaiting you.
- Qlik Community
- :
- All Forums
- :
- QlikView App Dev
- :
- Re: Need pie chart help - gap between pie chart re...
- Subscribe to RSS Feed
- Mark Topic as New
- Mark Topic as Read
- Float this Topic for Current User
- Bookmark
- Subscribe
- Mute
- Printer Friendly Page
- Mark as New
- Bookmark
- Subscribe
- Mute
- Subscribe to RSS Feed
- Permalink
- Report Inappropriate Content
Need pie chart help - gap between pie chart regions
Hi,
Can U tell me how to increase the space/gap between different regions in pie chart?
I have attached a screen shot of my pi chart and also I have couple of questions out there. Please give me suggestions on that questions.
Thanks,
Sandip
- Mark as New
- Bookmark
- Subscribe
- Mute
- Subscribe to RSS Feed
- Permalink
- Report Inappropriate Content
hi,
I have a table like this:
[Property]:
load * inline [
Property Name
Land
Assembly/Meeting Place
Land
Agricultural
Healthcare
Industrial
Sport & Entertainment
Assembly/Meeting Place
Agricultural
Healthcare
Assembly/Meeting Place
Sport & Entertainment
Land
Assembly/Meeting Place
Multi-Family
Healthcare
Sport & Entertainment
Healthcare
Assembly/Meeting Place
Agricultural
Healthcare
Office
Land
Sport & Entertainment
Retail-Commercial
Assembly/Meeting Place
Land
Lodging and hospitality
Healthcare
Lodging and hospitality
Self-Storage/Mini-storage
Lodging and hospitality
Special Purpose
Single-Family
Special Purpose
Lodging and hospitality
Agricultural
Special Purpose
];
Now I want to show different property type percentage among total property type. So Suppose 'Land' type is 4 times used among 56 times in property type data. So In the pie chart I want show Land [ 4% ] in data values in pie chart.So below is the picture of that:

I have used count([Property Name]) in first expression and Values on data points and Text as Popup, unchecked.
and have used =[Property Name] & ' - ' & num(count([Property Name])/Count(total [Property Name]), '##.##%')
as second expression and Values on data points and Text as Popup, checked.
So as a correct value should show for Land property type should show as Land [.25%] - when Land property type is appear 4 times among all property type.
So, please suggest what to do now.
Thanks,
Sandip
- Mark as New
- Bookmark
- Subscribe
- Mute
- Subscribe to RSS Feed
- Permalink
- Report Inappropriate Content
Hi Sandip,
I guess you have to share your file or at least a part of it.
For now your formula looks okay to me, so we have to take a look at the numbers..
Fred
- Mark as New
- Bookmark
- Subscribe
- Mute
- Subscribe to RSS Feed
- Permalink
- Report Inappropriate Content
Hi,
I have attached my .qvw file. Please go through it.
I think I almost done the thing, but when I select a particular area , it shows 100% which I think a error on my Pie Chart.
Thanks,
Sandip
- Mark as New
- Bookmark
- Subscribe
- Mute
- Subscribe to RSS Feed
- Permalink
- Report Inappropriate Content
Hi Sandip,
I think you're ready.
The fact that it's showing 100% after selecting 1 area is correct.
After all, after selecting that area, all your data, 100%, is part of that area.
Grtz Fred
- Mark as New
- Bookmark
- Subscribe
- Mute
- Subscribe to RSS Feed
- Permalink
- Report Inappropriate Content
Hi Grtz Fred,
Have u checked my qvw file? is it ok or show correct data for the pie chart?
Thanks,
Sandip Ghosh
- Mark as New
- Bookmark
- Subscribe
- Mute
- Subscribe to RSS Feed
- Permalink
- Report Inappropriate Content
Hi Sandip,
Your Pie is perfect this way!
Total count is 108, so the 36 Assembly is 33%.
Fred
- Mark as New
- Bookmark
- Subscribe
- Mute
- Subscribe to RSS Feed
- Permalink
- Report Inappropriate Content
Very small change 
- Mark as New
- Bookmark
- Subscribe
- Mute
- Subscribe to RSS Feed
- Permalink
- Report Inappropriate Content
hi,
i have a qlik view personal edition.so can't open the file. so please give me a screen shot what you have made changes to my qvw?
thanks
sandip ghosh
- Mark as New
- Bookmark
- Subscribe
- Mute
- Subscribe to RSS Feed
- Permalink
- Report Inappropriate Content
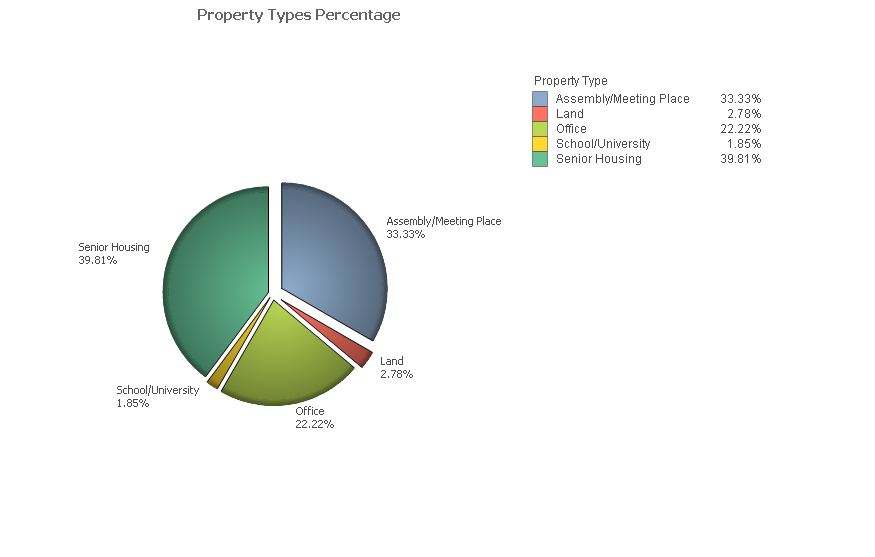
Sure. The second expression is
[Property Type] & chr(10) & num(count([Property Type])/Count(total [Property Type]), '##.##%')
The chart is: