Unlock a world of possibilities! Login now and discover the exclusive benefits awaiting you.
- Qlik Community
- :
- All Forums
- :
- QlikView App Dev
- :
- Re: Need the Result in attached format
- Subscribe to RSS Feed
- Mark Topic as New
- Mark Topic as Read
- Float this Topic for Current User
- Bookmark
- Subscribe
- Mute
- Printer Friendly Page
- Mark as New
- Bookmark
- Subscribe
- Mute
- Subscribe to RSS Feed
- Permalink
- Report Inappropriate Content
Need the Result in attached format
Hi Team,
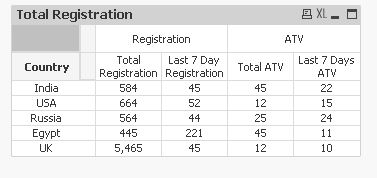
Need one quick help. I have two different excel which has to be loaded.Once both the excels are loaded i need the output in the exact attached format.
Kindly help.
Regards,
Avinash
- Mark as New
- Bookmark
- Subscribe
- Mute
- Subscribe to RSS Feed
- Permalink
- Report Inappropriate Content
Hi,
like this
create Pivot table chart object using below expression
try to create below 3 Dimension:
1) Country,
2) ValueList('Registration','ATV')
3) ValueList('Total Registration','Last 7 Day Registration','Total ATV','Last 7 Days ATV')
create Cal.Measure :
if( ValueList('Total Registration','Last 7 Day Registration','Total ATV','Last 7 Days ATV')='Total Registration' and
ValueList('Registration','ATV')='Registration',sum([Total Registration]),
if( ValueList('Total Registration','Last 7 Day Registration','Total ATV','Last 7 Days ATV')='Last 7 Day Registration' and
ValueList('Registration','ATV')='Registration',sum([Last 7 Day Registration]),
if( ValueList('Total Registration','Last 7 Day Registration','Total ATV','Last 7 Days ATV')='Total ATV' and
ValueList('Registration','ATV')='ATV',sum([Total ATV]),
if( ValueList('Total Registration','Last 7 Day Registration','Total ATV','Last 7 Days ATV')='Last 7 Days ATV' and
ValueList('Registration','ATV')='ATV',sum([Last 7 Days ATV])))))
Sort tab:
1) match('India','USA','Russia','Egypt','UK')
2) ValueList('Registration','ATV')
- Mark as New
- Bookmark
- Subscribe
- Mute
- Subscribe to RSS Feed
- Permalink
- Report Inappropriate Content
Thanks,
But how do i do the same formatting in qliksense.
- Mark as New
- Bookmark
- Subscribe
- Mute
- Subscribe to RSS Feed
- Permalink
- Report Inappropriate Content
Hi,
above mentioned valuelist expression should work in both qliksense and qlikview. just try to follow above steps.
P.S: for qliksense you have to create connection to import your excel source. and remaining steps are same above mentioned.
Close this thread by marking as correct.
Thanks
Deva
- Mark as New
- Bookmark
- Subscribe
- Mute
- Subscribe to RSS Feed
- Permalink
- Report Inappropriate Content
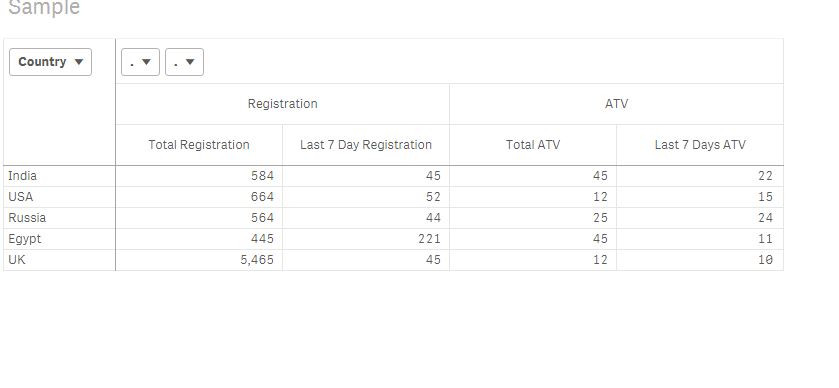
Hi,
refer to the qliksense version output,
- Mark as New
- Bookmark
- Subscribe
- Mute
- Subscribe to RSS Feed
- Permalink
- Report Inappropriate Content
Work around seems okay, But it optimize more size. i would prefer to create 2 island tables and use same for Match condition using Pick(Match()).. instead If..Else..