Unlock a world of possibilities! Login now and discover the exclusive benefits awaiting you.
- Qlik Community
- :
- All Forums
- :
- QlikView App Dev
- :
- Need to break the data into parts by rows
- Subscribe to RSS Feed
- Mark Topic as New
- Mark Topic as Read
- Float this Topic for Current User
- Bookmark
- Subscribe
- Mute
- Printer Friendly Page
- Mark as New
- Bookmark
- Subscribe
- Mute
- Subscribe to RSS Feed
- Permalink
- Report Inappropriate Content
Need to break the data into parts by rows
Hi
I am facing the issue to create a bucket.I have pulled a different field values from different table in the single chart.in chart the total values are 400. now i need to create bucket like bucket1 (1-100),bucket2 (101-200),bucket3 (201-300),bucket4 (301-400) as a 4 objects.
please find the attached file.Batch 1 ,batch 2,Batch 3 are the my excepted output based on above chart(Total rows 400).
please tell me how to break the rows into parts
Thanks
- Mark as New
- Bookmark
- Subscribe
- Mute
- Subscribe to RSS Feed
- Permalink
- Report Inappropriate Content
Hello Chandrrra,
try this script:
you Need to replace the first part with your Source Data.
//Source Data
BASE:
Load
RecNo() as ID,
'A' as country,
'aa' as state,
'bcc' as city
AutoGenerate 455;
LET vNoOfRows = NoOfRows('BASE');
LET i = 0;
//Create Parts (1-100, 101-200 ...)
For i = 1 to Round($(vNoOfRows)/100)
batch$(i):
LOAD
ID as ID$(i),
country as country$(i),
state as state$(i),
city as city$(i)
Resident BASE
WHERE ID >= if($(i)>1, (($(i)-1)*100)+1, $(i))
AND ID <= $(i)*100;
TRACE '>>>>>> fetched Batch $(i) <<<<<<<';
next
//Cleanup
LET i =;
LET vNoOfRows=;
- Mark as New
- Bookmark
- Subscribe
- Mute
- Subscribe to RSS Feed
- Permalink
- Report Inappropriate Content
Hi Chandra,
I found the data is loaded from 3 different sheets with same fields. By default, it will concatenate. Hence you have aliased the fields into different names.
But when you concatenate all the three tables and add a sheet name as a identifier fields, you will get single table.
What do you mean by bucket?
When i check the count of records in different table, it is not 400.
If you want to create three reports, you can set sheet as identifier and create it.
Regards,
Srini.
- Mark as New
- Bookmark
- Subscribe
- Mute
- Subscribe to RSS Feed
- Permalink
- Report Inappropriate Content
hi Tim
Thanks for reply.
I have raw data with 1000 records,my requirement is we have straight table with 600 rows in front End.Based on this chart i need to break the data like below
Batch1 (1-100 rows)
Batch2 (101-200 rows)
Batch3 (201-300 rows)
Batch4 (301-400 rows)
Batch5 (401-500 rows)
Batch6 (501-600 rows)
in frond end i need a list box:
Batch1
Batch2
Batch3
Batch4
Batch5
Batch6
if i click on Batch1 the first 100 rows(1-100 rows) should display,if i click on Batch2 the second 100 rows(101-200 rows) should display... in the straight table etc
- Mark as New
- Bookmark
- Subscribe
- Mute
- Subscribe to RSS Feed
- Permalink
- Report Inappropriate Content
check this:
- Mark as New
- Bookmark
- Subscribe
- Mute
- Subscribe to RSS Feed
- Permalink
- Report Inappropriate Content
hi tim,
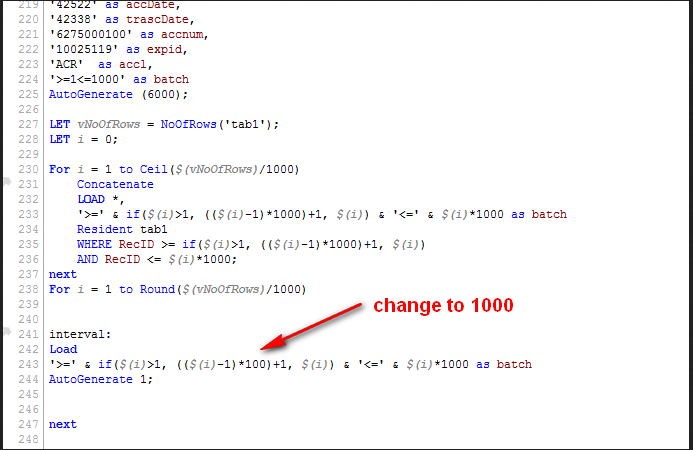
the code is working fine in sample qvw (interval.qvw).but it is not working on my real data, we pulled the data from excel.there is no error but displays wrong output actually i have 6000 rows in straight table.it is not dividing in a proper range
please check the attach images for reference
thanks
- Mark as New
- Bookmark
- Subscribe
- Mute
- Subscribe to RSS Feed
- Permalink
- Report Inappropriate Content
you just forgot one 0. check attached image.
- Mark as New
- Bookmark
- Subscribe
- Mute
- Subscribe to RSS Feed
- Permalink
- Report Inappropriate Content
Hi Tim
I am facing problem with RecNo(). when i added as dimension in straight table the record values are showing more values.i want to generate a rownum in the straight table(so i added a exp in straight table as rowNo(Total) as RowNum)then it is showing exect 5000.i want this 5000 into batches.if RecNo() in script then the data display more than 40,000 i dont want this records.
pls find the attach file for reference