Unlock a world of possibilities! Login now and discover the exclusive benefits awaiting you.
- Qlik Community
- :
- All Forums
- :
- QlikView App Dev
- :
- Re: Need to calculate Trend in straight table
- Subscribe to RSS Feed
- Mark Topic as New
- Mark Topic as Read
- Float this Topic for Current User
- Bookmark
- Subscribe
- Mute
- Printer Friendly Page
- Mark as New
- Bookmark
- Subscribe
- Mute
- Subscribe to RSS Feed
- Permalink
- Report Inappropriate Content
Need to calculate Trend in straight table
LS,
I need to calculate the trend as a result of 5 values in a straight table.
The dimension of the table is product.
As expressions the sales values of the last 4 weeks + current week are displayed.
These columns should be the input for the last column, in order to calculate the trend of the sales over these last 4 weeks.
something like the following example:
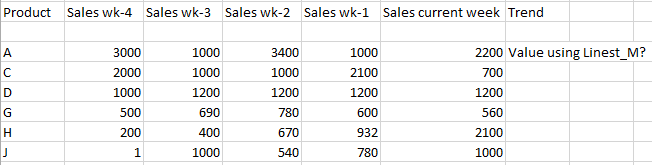
Is it possible to use these columns and calculate the linear trend using Linest_M?
Thx
Accepted Solutions
- Mark as New
- Bookmark
- Subscribe
- Mute
- Subscribe to RSS Feed
- Permalink
- Report Inappropriate Content
in the end solved it in the script by pre-calculating the slope per Product(level).
- Mark as New
- Bookmark
- Subscribe
- Mute
- Subscribe to RSS Feed
- Permalink
- Report Inappropriate Content
Just search the community for linest_m and straight table, there should be some examples to find, e.g.
Matching linest_m and linest_b function to auto-generated trendline
- Mark as New
- Bookmark
- Subscribe
- Mute
- Subscribe to RSS Feed
- Permalink
- Report Inappropriate Content
Hello Swuel,
I already did, the difference though is that in all the examples and discussions the dimension is a Date, number... or any sequence.
In this case the dimension is a Product and the 5 columns with their content are the values.and the sequence of the columns the seq.number (weeks from old to new)...
I cannot find any clear solution to this problem yet.
Any help would be greatly appreciated!
cheers.
- Mark as New
- Bookmark
- Subscribe
- Mute
- Subscribe to RSS Feed
- Permalink
- Report Inappropriate Content
Could you post a small sample QVW that demonstrates your setting?
I think it should be possible like described in the referenced thread, with adding Product dimension and Week number as dimensions to the aggr() function, and limit the number of weeks using set analysis.
- Mark as New
- Bookmark
- Subscribe
- Mute
- Subscribe to RSS Feed
- Permalink
- Report Inappropriate Content
Hello,
up till now this was the formula
aggr(linest_m(aggr(sum( { $< WkOcc={'0','1','2','3','4'}> } Amount),ProdKey,Date),Date),ProdKey)
I tried in the mentioned straight table. WkOcc is the indicator that says which week it is 0=current, 1 = 1wk old etc.. ProdKey = Product.
pls comment
Thx!
- Mark as New
- Bookmark
- Subscribe
- Mute
- Subscribe to RSS Feed
- Permalink
- Report Inappropriate Content
in the end solved it in the script by pre-calculating the slope per Product(level).
- Mark as New
- Bookmark
- Subscribe
- Mute
- Subscribe to RSS Feed
- Permalink
- Report Inappropriate Content
Hi,
Please can you share the script here? Thanks