Unlock a world of possibilities! Login now and discover the exclusive benefits awaiting you.
- Qlik Community
- :
- All Forums
- :
- QlikView App Dev
- :
- Re: Need to list top and bottom X products based o...
- Subscribe to RSS Feed
- Mark Topic as New
- Mark Topic as Read
- Float this Topic for Current User
- Bookmark
- Subscribe
- Mute
- Printer Friendly Page
- Mark as New
- Bookmark
- Subscribe
- Mute
- Subscribe to RSS Feed
- Permalink
- Report Inappropriate Content
Need to list top and bottom X products based on sales value???
Hi, Please help me to list say top and bottom 8 products based on sales for particular year? i should able to get by just entering X=? some no. to get the result.... please see the attachment for model template given to me
- Tags:
- new_to_qlikview
Accepted Solutions
- Mark as New
- Bookmark
- Subscribe
- Mute
- Subscribe to RSS Feed
- Permalink
- Report Inappropriate Content
See the attached file.
- Mark as New
- Bookmark
- Subscribe
- Mute
- Subscribe to RSS Feed
- Permalink
- Report Inappropriate Content
See the attached file.
- Mark as New
- Bookmark
- Subscribe
- Mute
- Subscribe to RSS Feed
- Permalink
- Report Inappropriate Content
Hi Erika jain... i couldn't see any attachment... please can u post it again
- Mark as New
- Bookmark
- Subscribe
- Mute
- Subscribe to RSS Feed
- Permalink
- Report Inappropriate Content
Hi,
All you have to do is Create a chart with Customer name. Add expression as Sum(Sales).
Go to Sort. Keep Sum(Sales) with ascending in case you want bottom customer and Descending in cae you want Top Customer.
You can limit the number from Properties-> Presentation -> Max Number(1 -100) ->Set this to 8.
Hope this will help you
Regards,
Kaushik Solanki
- Mark as New
- Bookmark
- Subscribe
- Mute
- Subscribe to RSS Feed
- Permalink
- Report Inappropriate Content
Hi,
Very Nice Example to help for that Top Values. It help very much.
Anand
Regards
- Mark as New
- Bookmark
- Subscribe
- Mute
- Subscribe to RSS Feed
- Permalink
- Report Inappropriate Content
hi, could you post the codes here?
i'm unable to open other users' files 
- Mark as New
- Bookmark
- Subscribe
- Mute
- Subscribe to RSS Feed
- Permalink
- Report Inappropriate Content
Good morning! friend
I am facing the same problem and I need your help
I try to display the first 10 sales per country in a Pivot table
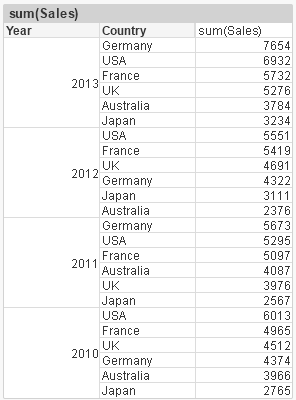
so I added this expression in dimensions

and as a result I have

as you can see for 2010 it gives a result USA-> France-> germany and the logical order is USA-> France-> UK
why?
Thank you for your answers
- Mark as New
- Bookmark
- Subscribe
- Mute
- Subscribe to RSS Feed
- Permalink
- Report Inappropriate Content
This is great but what is I want product to be selected on insertion of vTop variable.
Currently chart is changing on variable but there is no selection of subproducts.
I want product to be selected as well
Regards,
Gaurav