Unlock a world of possibilities! Login now and discover the exclusive benefits awaiting you.
- Qlik Community
- :
- All Forums
- :
- QlikView App Dev
- :
- Re: Need to show result in latest month in pivot t...
- Subscribe to RSS Feed
- Mark Topic as New
- Mark Topic as Read
- Float this Topic for Current User
- Bookmark
- Subscribe
- Mute
- Printer Friendly Page
- Mark as New
- Bookmark
- Subscribe
- Mute
- Subscribe to RSS Feed
- Permalink
- Report Inappropriate Content
Need to show result in latest month in pivot table
Hi,
We have the following requirement:
ID | Outcome | Date |
|---|---|---|
| 1234 | abcd | 20th Oct 2017 |
| 1234 | bcde | 20th Sep 2017 |
We need to show the days difference between two Outcomes,when the ID is same.
and will be showing in a pivot table,which shows the month wise values.
In pivot table we need to show in Oct 2017 , and the result will be 30 for this above example, how we can achieve this scenario ?
Thanks in Advance... 
- Tags:
- qlikview_scripting
- Mark as New
- Bookmark
- Subscribe
- Mute
- Subscribe to RSS Feed
- Permalink
- Report Inappropriate Content
Is Outcome one of your dimension? or will you only have ID as dimension.
If Outcome is a dimension... may you just need this
Date - Below(Date)
- Mark as New
- Bookmark
- Subscribe
- Mute
- Subscribe to RSS Feed
- Permalink
- Report Inappropriate Content
No, Outcome is not our dimension.
There are 2 dimensions, 1 st one is bucket. Bucket logic is days difference when outcome= abcd and outcome= bcde. fetching the days difference from Date field.
and another is the time dimension,this dimension we are fetching from the Date field. where we will be showing Month Year( eg. Oct 2017).
and we need to show the days difference for this bucket in Max month year dimension.
- Mark as New
- Bookmark
- Subscribe
- Mute
- Subscribe to RSS Feed
- Permalink
- Report Inappropriate Content
How would the output table look like for the two rows of data you have provided above?
- Mark as New
- Bookmark
- Subscribe
- Mute
- Subscribe to RSS Feed
- Permalink
- Report Inappropriate Content
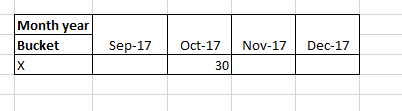
Its a Pivot table. In row , we will be having the bucket(X), and in column we will be having the Month year Dimension.
The table will look like the below structure:
- Mark as New
- Bookmark
- Subscribe
- Mute
- Subscribe to RSS Feed
- Permalink
- Report Inappropriate Content
When applicable please mark the appropriate replies as CORRECT. This will help community members and Qlik Employees know which discussions have already been addressed and have a possible known solution. Please mark threads as HELPFUL if the provided solution is helpful to the problem, but does not necessarily solve the indicated problem. You can mark multiple threads as HELPFUL if you feel additional info is useful to others