Unlock a world of possibilities! Login now and discover the exclusive benefits awaiting you.
- Qlik Community
- :
- All Forums
- :
- QlikView App Dev
- :
- Re: Need to show top 3 color coding
- Subscribe to RSS Feed
- Mark Topic as New
- Mark Topic as Read
- Float this Topic for Current User
- Bookmark
- Subscribe
- Mute
- Printer Friendly Page
- Mark as New
- Bookmark
- Subscribe
- Mute
- Subscribe to RSS Feed
- Permalink
- Report Inappropriate Content
Need to show top 3 color coding
Hi All,
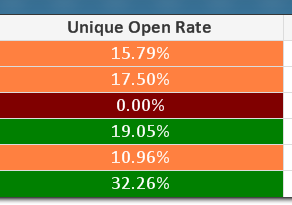
I have an straight table chart. I have an expression like (sum([Unique Opens])/sum([Total Sends]-([Total Bouncebacks])))
You can see the values as in the attached image:
Now my requirement i need to show i mean highlight the values in green color which are top 3. I need to show it with an indicator.
Kindly help.
- Tags:
- qlikview_scripting
- Mark as New
- Bookmark
- Subscribe
- Mute
- Subscribe to RSS Feed
- Permalink
- Report Inappropriate Content
Bharat Kishore wrote:
Not top 3. I need to show only top 3 in green color else no color.
What is the mean of that?
- Mark as New
- Bookmark
- Subscribe
- Mute
- Subscribe to RSS Feed
- Permalink
- Report Inappropriate Content
You don't seem to have tried to implement my solution at all?
My solution will work, simply exclude the other colours from the ranking
- Mark as New
- Bookmark
- Subscribe
- Mute
- Subscribe to RSS Feed
- Permalink
- Report Inappropriate Content
Sorry typo my mistake..I need to show top 3 numbers in green color for respective market and brand.
for example: I have
1
4
5
7
6
9
Now 9,6,7, should be in green color...remaining values no color in indicator symbol..
- Mark as New
- Bookmark
- Subscribe
- Mute
- Subscribe to RSS Feed
- Permalink
- Report Inappropriate Content
So this is a new requirement to the original one?
I have no problem trying to help but this is getting a little confusing now
- Mark as New
- Bookmark
- Subscribe
- Mute
- Subscribe to RSS Feed
- Permalink
- Report Inappropriate Content
Hi Adam,
I have tried your solution as well.
But please see the attached image: here also i can see you can see highlighting only two are in green color. I Need top 3.
- Mark as New
- Bookmark
- Subscribe
- Mute
- Subscribe to RSS Feed
- Permalink
- Report Inappropriate Content
No no.. this is of yesterday requirement..
- Mark as New
- Bookmark
- Subscribe
- Mute
- Subscribe to RSS Feed
- Permalink
- Report Inappropriate Content
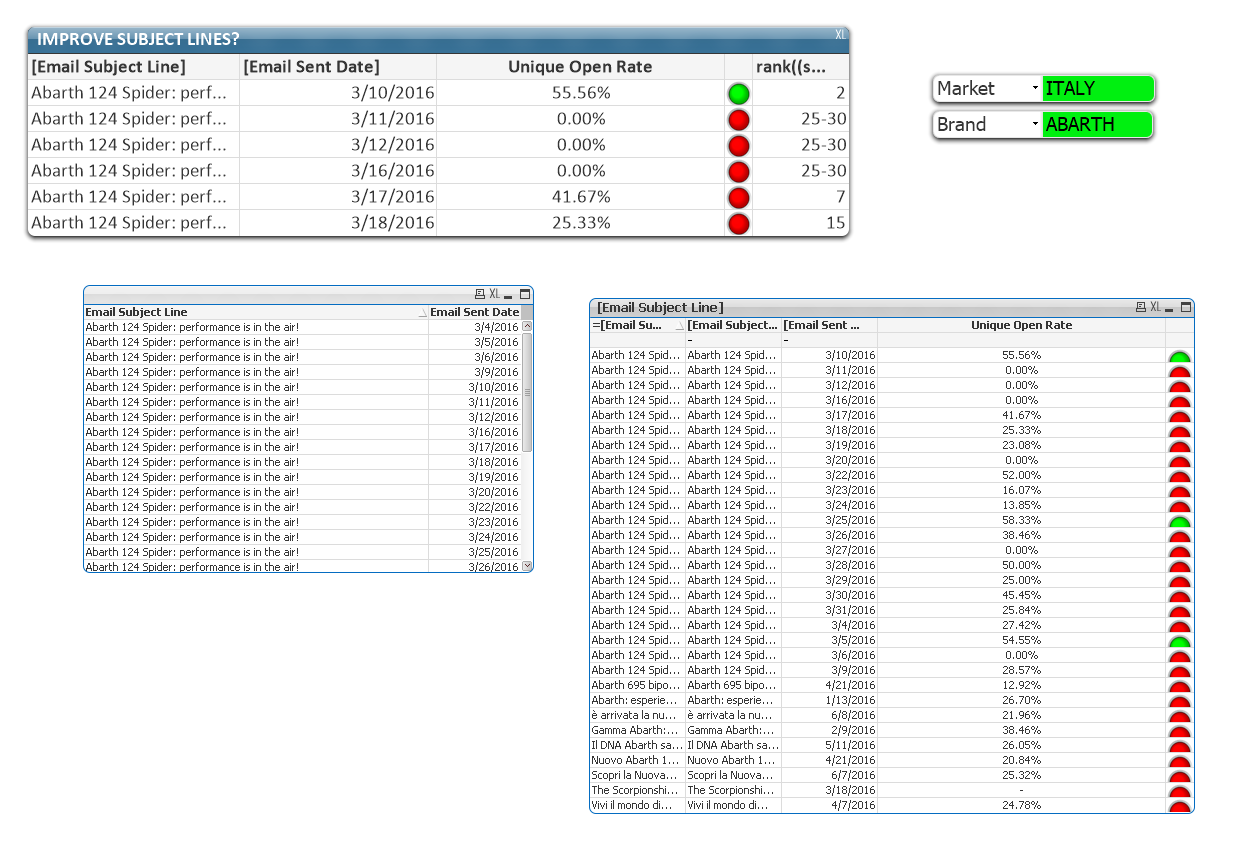
There is something really weird going on with your chart and the way it is displaying. It's not showing all values and I can't spot why but there must be something obvious
I created a new one and it works fine, see bottom right table:
- Mark as New
- Bookmark
- Subscribe
- Mute
- Subscribe to RSS Feed
- Permalink
- Report Inappropriate Content
Yes i needed exactly the same way.. can u pls help how can i get that one..
N what expression i need to add..
- Mark as New
- Bookmark
- Subscribe
- Mute
- Subscribe to RSS Feed
- Permalink
- Report Inappropriate Content
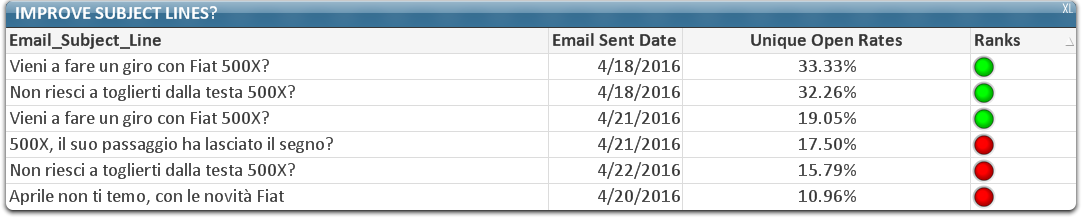
I agree with Adam Davies. Please check your data it seems something is not right some sort or redundant data might be causing issue. anyways I did a rank total and then a sorting on the rank and found the solution the way you want. please take a look.
- Mark as New
- Bookmark
- Subscribe
- Mute
- Subscribe to RSS Feed
- Permalink
- Report Inappropriate Content
I did nothing other than what I showed in my example above.
I don't think its a data issue but something in your table is really screwy!