Unlock a world of possibilities! Login now and discover the exclusive benefits awaiting you.
- Qlik Community
- :
- All Forums
- :
- QlikView App Dev
- :
- Re: Needs help in loop within chart
- Subscribe to RSS Feed
- Mark Topic as New
- Mark Topic as Read
- Float this Topic for Current User
- Bookmark
- Subscribe
- Mute
- Printer Friendly Page
- Mark as New
- Bookmark
- Subscribe
- Mute
- Subscribe to RSS Feed
- Permalink
- Report Inappropriate Content
Needs help in loop within chart
Hi All,
I created the below example to show my case. Lets say that I have these two inline tables:
[Subjects]:
LOAD * INLINE [
    Subject, ValueOf
    'Subject 123', 12
    'Subject 456', 30
    'Subject 789', 46
    'Subject 101', 22
    'Subject 111', 51
];
The above inline table contains the subjects and each subject value.
[HandelRates]:
LOAD * INLINE [
    FromValue, ToValue, Rate
    1, 25, 1
    26, 40, 2
    41, 60, 3
    61, 80, 4
    81, 100, 5
];
the above inline table contains the rates of subjects. so in case the subject X has value 15 so its rate is 1 because 15 is between 1 and 25.
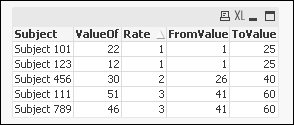
So I need to have a chart (table) as shown below:
with each "Subject" I should show the "Rate" based on the subject's "ValueOf". If the "ValueOf" is between the "FromValue" and "ToValue" then show the "Rate".
I added the sample in the attachments.
any one can help me with this? please advice.
- « Previous Replies
-
- 1
- 2
- Next Replies »
Accepted Solutions
- Mark as New
- Bookmark
- Subscribe
- Mute
- Subscribe to RSS Feed
- Permalink
- Report Inappropriate Content
Hi,
Try like this
HandelRates:
LOAD * INLINE [
FromValue, ToValue, Rate
1, 25, 1
26, 40, 2
41, 60, 3
61, 80, 4
81, 100, 5
];
Subjects:
LOAD * INLINE [
Subject, ValueOf
'Subject 123', 12
'Subject 456', 30
'Subject 789', 46
'Subject 101', 22
'Subject 111', 51
];
Chart : Straight Table
Dimension: Subject, ValueOf
Expression: =Aggr(If([ValueOf] >= FromValue AND [ValueOf] <= ToValue, Rate), FromValue, ToValue, Subject)
But if possible handle this in scirpt by using IntervalMatch() otherwise you will get performance issues if data is huge.
Hope this helps you.
Regards,
jagan.
- Mark as New
- Bookmark
- Subscribe
- Mute
- Subscribe to RSS Feed
- Permalink
- Report Inappropriate Content
try with Interval Match function
Vikas
If the issue is solved please mark the answer with Accept as Solution & like it.
If you want to go quickly, go alone. If you want to go far, go together.
- Mark as New
- Bookmark
- Subscribe
- Mute
- Subscribe to RSS Feed
- Permalink
- Report Inappropriate Content
Subjects:
LOAD * INLINE
[
    Subject, ValueOf
    'Subject 123', 12
    'Subject 456', 30
    'Subject 789', 46
    'Subject 101', 22
    'Subject 111', 51
];


HandelRates:
LOAD * INLINE
[
    FromValue, ToValue, Rate
    1, 25, 1
    26, 40, 2
    41, 60, 3
    61, 80, 4
    81, 100, 5
];


Left Join
IntervalMatch(ValueOf) Load
FromValue, ToValue
Resident HandelRates;


Left Join (Subjects)
Load * Resident HandelRates;


Drop Table HandelRates;
- Mark as New
- Bookmark
- Subscribe
- Mute
- Subscribe to RSS Feed
- Permalink
- Report Inappropriate Content
Hi Mohammed,
Try,
HandelRates:
LOAD * INLINE [
    FromValue, ToValue, Rate
    1, 25, 1
    26, 40, 2
    41, 60, 3
    61, 80, 4
    81, 100, 5
];


Subjects:
LOAD * INLINE [
    Subject, ValueOf
    'Subject 123', 12
    'Subject 456', 30
    'Subject 789', 46
    'Subject 101', 22
    'Subject 111', 51
];


LEFT JOIN (Subjects)
IntervalMatch(ValueOf)
LOAD FromValue,
     ToValue
RESIDENT HandelRates;
LEFT JOIN (Subjects)
LOAD *
RESIDENT HandelRates;
DROP Table HandelRates;
- Mark as New
- Bookmark
- Subscribe
- Mute
- Subscribe to RSS Feed
- Permalink
- Report Inappropriate Content
Hi Mohammed,
as an alternative to IntervalMatch function you can do it like this:
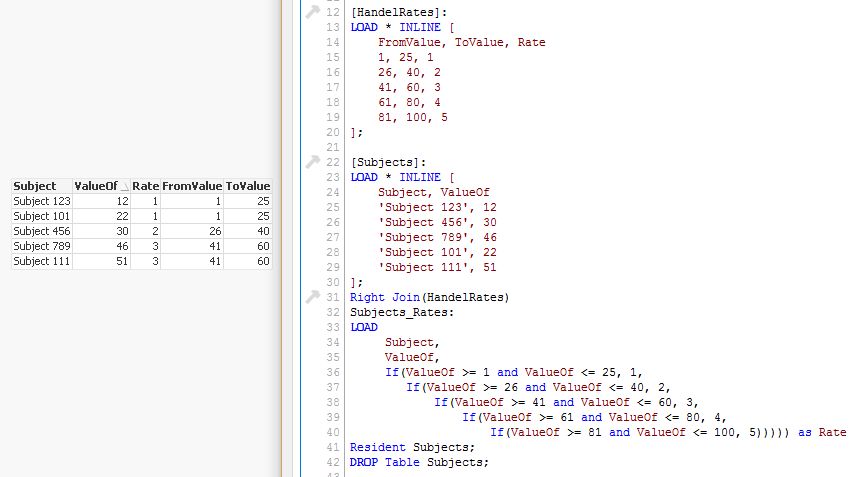
Hope this helps.
Burkhard
- Mark as New
- Bookmark
- Subscribe
- Mute
- Subscribe to RSS Feed
- Permalink
- Report Inappropriate Content
Thank you all for the replies.
I need to achieve this through the QlikView set analysis.
This should be done by the user. I don't need to do it in the script itself.
is their any way to do that?
- Mark as New
- Bookmark
- Subscribe
- Mute
- Subscribe to RSS Feed
- Permalink
- Report Inappropriate Content
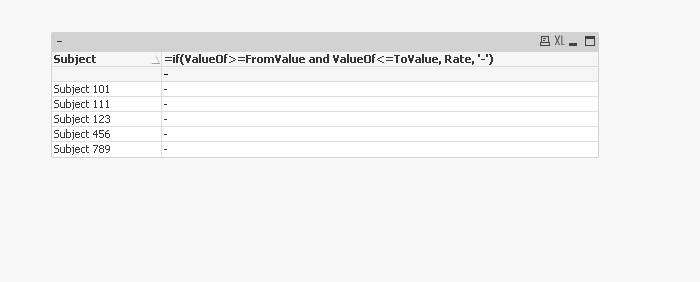
I can say that I need the result to be looks like below but using set analysis or expression
- Mark as New
- Bookmark
- Subscribe
- Mute
- Subscribe to RSS Feed
- Permalink
- Report Inappropriate Content
- Mark as New
- Bookmark
- Subscribe
- Mute
- Subscribe to RSS Feed
- Permalink
- Report Inappropriate Content
Burkhard Veidl's suggestion is valid in case the data of FromValueand ToValue are static but in my case these values are dynamic and retrievable from a data source.
- Mark as New
- Bookmark
- Subscribe
- Mute
- Subscribe to RSS Feed
- Permalink
- Report Inappropriate Content
dears,
any idea. this is my first post here 
I really needs help for this issue.
- « Previous Replies
-
- 1
- 2
- Next Replies »