Unlock a world of possibilities! Login now and discover the exclusive benefits awaiting you.
- Qlik Community
- :
- All Forums
- :
- QlikView App Dev
- :
- Re: Object Out of Memory Issue
- Subscribe to RSS Feed
- Mark Topic as New
- Mark Topic as Read
- Float this Topic for Current User
- Bookmark
- Subscribe
- Mute
- Printer Friendly Page
- Mark as New
- Bookmark
- Subscribe
- Mute
- Subscribe to RSS Feed
- Permalink
- Report Inappropriate Content
Object Out of Memory Issue
Hi All,
My straight chart is giving an Object Out of memory Error and taking a lot of time to load .Most of the time it becomes not responding and crash.It works if i keep the selection limited to few months but crashes once i take the complete selection.
How to solve this issue.Iam fetching a lot of data into this chart ![]()
Regards
KC
KC
- Tags:
- new_to_qlikview
Accepted Solutions
- Mark as New
- Bookmark
- Subscribe
- Mute
- Subscribe to RSS Feed
- Permalink
- Report Inappropriate Content
Possible solutions:
- Redesign your straight table. Perhaps you can use expressions that require less resources. Or add fewer dimensions and/or expression to your chart.
- Load less data in the chart by forcing selections to limit the number of rows
- Redesign your data model. Perhaps your data model is not optimal and causes Cartesian products in your chart.
- Add more ram to your machine
talk is cheap, supply exceeds demand
- Mark as New
- Bookmark
- Subscribe
- Mute
- Subscribe to RSS Feed
- Permalink
- Report Inappropriate Content
Prefilter with some selection or make expression easier to compute
- Mark as New
- Bookmark
- Subscribe
- Mute
- Subscribe to RSS Feed
- Permalink
- Report Inappropriate Content
Possible solutions:
- Redesign your straight table. Perhaps you can use expressions that require less resources. Or add fewer dimensions and/or expression to your chart.
- Load less data in the chart by forcing selections to limit the number of rows
- Redesign your data model. Perhaps your data model is not optimal and causes Cartesian products in your chart.
- Add more ram to your machine
talk is cheap, supply exceeds demand
- Mark as New
- Bookmark
- Subscribe
- Mute
- Subscribe to RSS Feed
- Permalink
- Report Inappropriate Content
Hi Gysbert,
Thanks alot for your reply.Iam fetching data from 200 different excel sheets and consollidating then using QV and pulling all the data into staright chart (Table).I have to capture all the informations in that.Cant optimise by using set analysis or any thing.I have a lot of data 2,50,000 rows and almost 20 fields in Expresion.
Regards
KC
KC
- Mark as New
- Bookmark
- Subscribe
- Mute
- Subscribe to RSS Feed
- Permalink
- Report Inappropriate Content
I assume you mean 2.5 million rows. Nobody, let me repeat, nobody can analyse that amount of data on a row-by-row basis in any same amount of time. I don't know how many dimensions your using in that chart, but 20 expressions is a high amount too if you intend to show them all at the same time. Why do you need all that information at the same time in only one chart?
talk is cheap, supply exceeds demand
- Mark as New
- Bookmark
- Subscribe
- Mute
- Subscribe to RSS Feed
- Permalink
- Report Inappropriate Content
Try to split data in the dashboard.
So that there will be no out of memory error in the dashboard
- Mark as New
- Bookmark
- Subscribe
- Mute
- Subscribe to RSS Feed
- Permalink
- Report Inappropriate Content
I totally agree with Gysbert on this. Nobody can analyse the amount of data that you are including on that straight table.
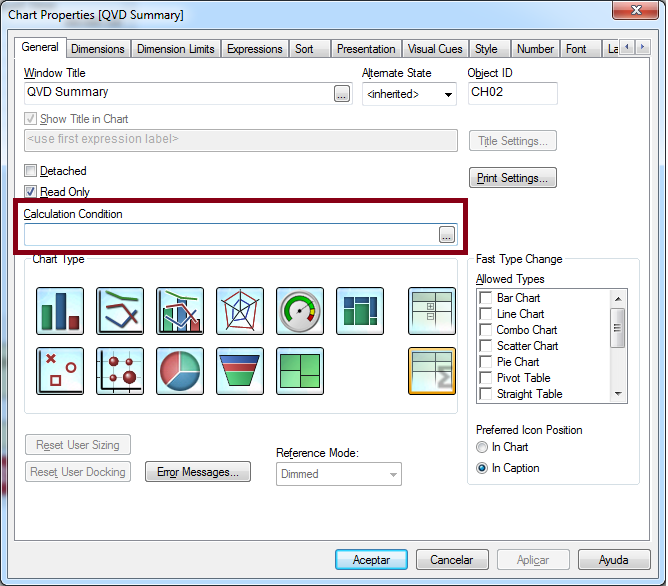
One thing you could try is calculating the table only when certain conditions are made (for example, count(distinct [Month]) <= 3).
To do this go to the properties of the straight table and add this condition:

This way you won't get the out of memory error. Make sure that you inform the users of the conditions that need to be met before the data can be displayed on the table.
Also try calculating the expressions during the load script. This way you will use less memory while using the app.
If what you need is to export the data, remember you can do this also during the loading process with a store command.
- Mark as New
- Bookmark
- Subscribe
- Mute
- Subscribe to RSS Feed
- Permalink
- Report Inappropriate Content
Got your point Gysbert, but i have to load all those data together, thats the requirement.I have to submitt those data on a weekly basis to higher management and they ask for old data also,because of that i was keeping all data together. Now,i will spilt those data into two or three charts as per year, hope it will works.
Thanks a lot ![]()
Regards
KC
KC