Unlock a world of possibilities! Login now and discover the exclusive benefits awaiting you.
Announcements
Customer Spotlight: Discover what’s possible with embedded analytics Oct. 16 at 10:00 AM ET:
REGISTER NOW
- Qlik Community
- :
- All Forums
- :
- QlikView App Dev
- :
- Re: Only to Display Quarter End Values
Options
- Subscribe to RSS Feed
- Mark Topic as New
- Mark Topic as Read
- Float this Topic for Current User
- Bookmark
- Subscribe
- Mute
- Printer Friendly Page
Turn on suggestions
Auto-suggest helps you quickly narrow down your search results by suggesting possible matches as you type.
Showing results for
Anonymous
Not applicable
2014-10-14
01:01 PM
- Mark as New
- Bookmark
- Subscribe
- Mute
- Subscribe to RSS Feed
- Permalink
- Report Inappropriate Content
Only to Display Quarter End Values
I have the below data:
| YRMON | Amount1 | Amount2 |
| 201301 | 100 | |
| 201302 | 200 | 700 |
| 201303 | 300 | 800 |
| 201304 | 400 | |
| 201305 | 500 | 1000 |
| 201306 | 600 | 1100 |
| 201307 | 700 | 1200 |
| 201308 | 800 | |
| 201309 | 900 | 1300 |
| 201310 | 1000 | 1500 |
| 201311 | 1100 | 1600 |
| 201312 | 1200 | 1700 |
| 201401 | 1300 | 1800 |
| 201402 | 1400 | |
| 201403 | 1500 | 2000 |
| 201404 | 1600 | |
| 201405 | 1700 | 2200 |
| 201406 | 1800 | 2300 |
| 201407 | 1900 | |
| 201408 | 2000 | 2500 |
| 201409 | 2100 | 2600 |
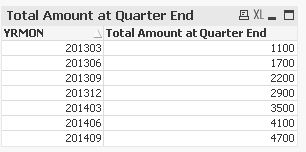
OUTPUT:
| 201303 | 1100 |
| 201306 | 1700 |
| 201309 | 2200 |
| 201312 | 2900 |
| 201403 | 3100 |
| 201406 | 4100 |
| 201409 | 4700 |
I want to display in a chart only the Quarter End Year-Mon(Dimension) and the values of the Quarter end as shown above not the sum of the Quarters. Basically the above output in a chart. Please any one can help
929 Views
1 Solution
Accepted Solutions
MVP
2014-10-14
06:49 PM
- Mark as New
- Bookmark
- Subscribe
- Mute
- Subscribe to RSS Feed
- Permalink
- Report Inappropriate Content
607 Views
4 Replies
Master II
2014-10-14
01:07 PM
- Mark as New
- Bookmark
- Subscribe
- Mute
- Subscribe to RSS Feed
- Permalink
- Report Inappropriate Content
Please do not double post, it makes the community harder for everyone to use. Consolidate your discussion under http://community.qlik.com/thread/137787 and close this thread.
Thanks,
Vlad
607 Views
Anonymous
Not applicable
2014-10-14
01:12 PM
Author
- Mark as New
- Bookmark
- Subscribe
- Mute
- Subscribe to RSS Feed
- Permalink
- Report Inappropriate Content
Didn't got answer in the earlier thread so had to put it in the different discussion forum. But wont do it next time.
607 Views
Master II
2014-10-14
01:19 PM
- Mark as New
- Bookmark
- Subscribe
- Mute
- Subscribe to RSS Feed
- Permalink
- Report Inappropriate Content
Replied to your original post.
MVP
2014-10-14
06:49 PM
- Mark as New
- Bookmark
- Subscribe
- Mute
- Subscribe to RSS Feed
- Permalink
- Report Inappropriate Content
Hi,
one solution could be:
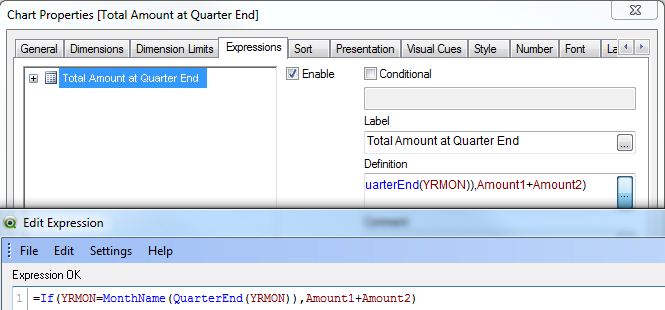
hope this helps
regards
Marco
608 Views