Unlock a world of possibilities! Login now and discover the exclusive benefits awaiting you.
- Qlik Community
- :
- All Forums
- :
- QlikView App Dev
- :
- Overlay 2 rolling 12 month charts in one
- Subscribe to RSS Feed
- Mark Topic as New
- Mark Topic as Read
- Float this Topic for Current User
- Bookmark
- Subscribe
- Mute
- Printer Friendly Page
- Mark as New
- Bookmark
- Subscribe
- Mute
- Subscribe to RSS Feed
- Permalink
- Report Inappropriate Content
Overlay 2 rolling 12 month charts in one
Hi All,
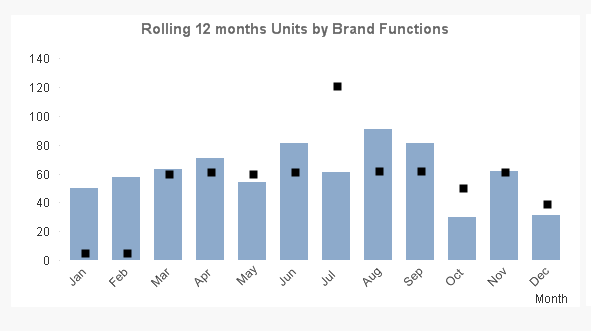
My latest requirement is to create a chart that shows two rolling 12 month as a comparison of one another.
I am able to show them separately as 24 month period. However, when I overlay them by month as dimension I am unable to sort them based on the latest month values. The chart automatically sorts from Jan - Dec or Dec-Jan and not by the latest month to the last 12 months.
Can someone please help with this 
Thanks in advance.!
- Mark as New
- Bookmark
- Subscribe
- Mute
- Subscribe to RSS Feed
- Permalink
- Report Inappropriate Content
What is MonthCount field here? Month_No? You expression uses MonthCount, but I don't see any field with that name?
- Mark as New
- Bookmark
- Subscribe
- Mute
- Subscribe to RSS Feed
- Permalink
- Report Inappropriate Content
Hi Sneha,
the file you attached doesn't contain a Date field so this will be difficult to fix in that!
Try max(Month_Conseq_No) instead
Marcus
- Mark as New
- Bookmark
- Subscribe
- Mute
- Subscribe to RSS Feed
- Permalink
- Report Inappropriate Content
May be this as your sort expression
Month(Date#(Only({1}Month), 'MMM'))
- Mark as New
- Bookmark
- Subscribe
- Mute
- Subscribe to RSS Feed
- Permalink
- Report Inappropriate Content
Hi Sunny,
MonthCount is the a consecutive count of Month over all years. So in 2015 Aug its 1, and Jan 2016 its 6 and so on.
- Mark as New
- Bookmark
- Subscribe
- Mute
- Subscribe to RSS Feed
- Permalink
- Report Inappropriate Content
Did my response below makes sense?
- Mark as New
- Bookmark
- Subscribe
- Mute
- Subscribe to RSS Feed
- Permalink
- Report Inappropriate Content
Hi Sunny,
Thanks, however this is not dynamic based on the selections made for year/month.
=max(Month_Conseq_No)
The above works fine on Dummy table - however, when I use it in my app it does the same as date. Jun first then Jan..Dec.
- Mark as New
- Bookmark
- Subscribe
- Mute
- Subscribe to RSS Feed
- Permalink
- Report Inappropriate Content
Hi Marcus,
max(Month_Conseq_No)
The above works fine on Dummy table - however, when I use it in my app it does the same as date. Jun first then Jan..Dec.
Any thoughts, on what needs to change in my app to accommodate this?
- Mark as New
- Bookmark
- Subscribe
- Mute
- Subscribe to RSS Feed
- Permalink
- Report Inappropriate Content
Where is =max(Month_Conseq_No) coming from? I asked you to use Month(Date#(Only({1}Month), 'MMM'))
- Mark as New
- Bookmark
- Subscribe
- Mute
- Subscribe to RSS Feed
- Permalink
- Report Inappropriate Content
Hi Sunny,
I did try your expression and as I said its not dynamic. It displays data from Jan - Dec and Dec- Jan. It's not sorting it based on the month selected. That's why I told about the one that works on test file but not on my original data set.
- Mark as New
- Bookmark
- Subscribe
- Mute
- Subscribe to RSS Feed
- Permalink
- Report Inappropriate Content
I got it... so for example if you select March, you want the sorting to begin at March, Apr... Dec, Jan, Feb?