Unlock a world of possibilities! Login now and discover the exclusive benefits awaiting you.
- Qlik Community
- :
- All Forums
- :
- QlikView App Dev
- :
- Re: PIVOT CHART ISSUE
- Subscribe to RSS Feed
- Mark Topic as New
- Mark Topic as Read
- Float this Topic for Current User
- Bookmark
- Subscribe
- Mute
- Printer Friendly Page
- Mark as New
- Bookmark
- Subscribe
- Mute
- Subscribe to RSS Feed
- Permalink
- Report Inappropriate Content
PIVOT CHART ISSUE
I am trying ti accomplish the attached chart in Qlikview(Report.png) . So far I was able to Get the Attached chart in the Pivot Table with First Dimension as (Claim Type Code) and Second one is a Calculated Dimension (=ValueList('Sum','AVG') ).
The problem is that I cant get the Totals of every thing like in the Chart (QV_Result.png)
Any suggestions.
- « Previous Replies
-
- 1
- 2
- Next Replies »
- Mark as New
- Bookmark
- Subscribe
- Mute
- Subscribe to RSS Feed
- Permalink
- Report Inappropriate Content
Hi Ray,
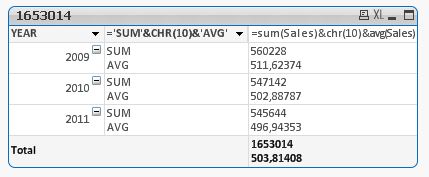
You might use this alternative if it suites you (see expression in attached screenshot)
Hth,
Michael

- Mark as New
- Bookmark
- Subscribe
- Mute
- Subscribe to RSS Feed
- Permalink
- Report Inappropriate Content
The second column u have is that a Calculated Dimension???
- Mark as New
- Bookmark
- Subscribe
- Mute
- Subscribe to RSS Feed
- Permalink
- Report Inappropriate Content
I am getting only the SUM No Average, what am I missing??
- Mark as New
- Bookmark
- Subscribe
- Mute
- Subscribe to RSS Feed
- Permalink
- Report Inappropriate Content
(=ValueList('Sum','AVG') ).
Instead of this use this expression
(=Sum(Sales)&chr(10)&avg(Sales))
- Mark as New
- Bookmark
- Subscribe
- Mute
- Subscribe to RSS Feed
- Permalink
- Report Inappropriate Content
Thast not gonna work cuz what u are doing is providing the calculations in the Dimensions??
- Mark as New
- Bookmark
- Subscribe
- Mute
- Subscribe to RSS Feed
- Permalink
- Report Inappropriate Content
Only the SUM or AVG labels are calculated dimension since it's not linked to a field in the model it cannot affect the performance.
The computation of sum and avg is well made in a expression, the trick is that we use a carriage return (chr(10)) to display the results on two lines.
Valuelist or Valueloop do not atuhtorized total aggregation since it detached of the model.
- Mark as New
- Bookmark
- Subscribe
- Mute
- Subscribe to RSS Feed
- Permalink
- Report Inappropriate Content
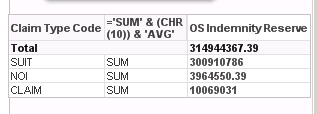
Attached is my Result screen shot. I am not getting the AVG in there. I am using Pivot Table with Partial Sums checked
- Mark as New
- Bookmark
- Subscribe
- Mute
- Subscribe to RSS Feed
- Permalink
- Report Inappropriate Content
Go to Presentation tab and set Wrap cell text in 2 lines to make the AVG ligne displayed.
Michael
- Mark as New
- Bookmark
- Subscribe
- Mute
- Subscribe to RSS Feed
- Permalink
- Report Inappropriate Content
Thnx Man that Did it
- « Previous Replies
-
- 1
- 2
- Next Replies »