Unlock a world of possibilities! Login now and discover the exclusive benefits awaiting you.
- Qlik Community
- :
- All Forums
- :
- QlikView App Dev
- :
- Re: Partial total in load script for graph categor...
- Subscribe to RSS Feed
- Mark Topic as New
- Mark Topic as Read
- Float this Topic for Current User
- Bookmark
- Subscribe
- Mute
- Printer Friendly Page
- Mark as New
- Bookmark
- Subscribe
- Mute
- Subscribe to RSS Feed
- Permalink
- Report Inappropriate Content
Partial total in load script for graph category
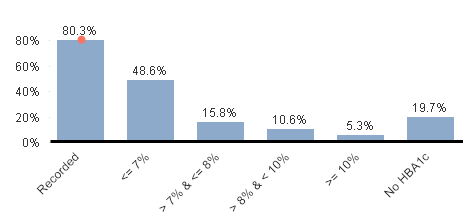
I'm trying to develop a graph with the dimension of 'Diab_Hb_line' with left to right being Recorded, <=7%, > 7% & <= 8%, > 8% & < 10%, >= 10%, No HBA1c.
Currently I have a work around as below load script where I pull the 'Recorded' from another dataset. What I would like instead is to add the <=7%, > 7% & <= 8%, > 8% & < 10%, >= 10% amounts to create a 'Recorded' amount BUT also have them displayed separately on the graph as above. I can't seem to find load script which has the kind of set analysis for a sum I am looking for.
The reason I'd like this is that there are a few other graphs I need to do a similar thing to and there is no other dataset with the recorded total for these.
Thanks.
if(SubField(Diab_Ind_Type,'_',2) = 'Total Patients with valid HbA1c percentage', 'Recorded',
if(Diab_Hbraw = '<= 7%', '<= 7%',
if(Diab_Hbraw = '> 7% & <= 8%', '> 7% & <= 8%',
if(Diab_Hbraw = '> 8% & < 10%', '> 8% & < 10%',
if(Diab_Hbraw = '>= 10%', '>= 10%',
if(Diab_Hbraw = 'No HBA1c Recorded', 'No HBA1c'
))))))as Diab_Hb_line
- Mark as New
- Bookmark
- Subscribe
- Mute
- Subscribe to RSS Feed
- Permalink
- Report Inappropriate Content
If I understood correctly, you could create a link table linked to Diab_Hbraw and basically load your linked field twice, once with the detailed classification and once with all Diab_Hbraw values linked to 'Recorded'.
Similar to what is shown here
- Mark as New
- Bookmark
- Subscribe
- Mute
- Subscribe to RSS Feed
- Permalink
- Report Inappropriate Content
I don't know what a link table is. Could you provide the load script for your idea please?
- Mark as New
- Bookmark
- Subscribe
- Mute
- Subscribe to RSS Feed
- Permalink
- Report Inappropriate Content
Well, link table might not be the correct phrase, maybe group table would be more appropriate.
There is some script code in the thread I referenced above and a full example in the cookbook sample file that Rob is linking in his answer.
If you still have problems getting your issue resolved, please post a small sample QVW and a detailed description of your requested result.
- Mark as New
- Bookmark
- Subscribe
- Mute
- Subscribe to RSS Feed
- Permalink
- Report Inappropriate Content
Sorry I don't have an IT background so trying to convert some of the script examples is a real challenge. I've been struggling with this for days and was pretty impressed with my ability to get the work around script.
This is the end graph I want when considering percentages but I also work with numbers as well.

The raw data has the following where each has a number of patients with value in their HbA1c test. So for example Practice 1 may have 300 people who have a Diab_Hbraw of <=7%, etc as below
Diab_Hbraw = '<= 7%' ---300
Diab_Hbraw = '> 7% & <= 8%' ---100
Diab_Hbraw = '> 8% & < 10%' --- 200
Diab_Hbraw = '>= 10%' ---50
Diab_Hbraw = 'No HBA1c Recorded' ---225
On my graph I would like Recorded (300+100+200+50) so 650; <=7% 300; > 7% & <= 8% 100; > 8% & < 10% 200; >= 10% 50; No HbA1c 225.
I have two datasets combined in this graph - my load script above shows how I pull the 'Recorded' from one dataset and the rest from another. My data is for multiple practices so I select by practice and month. [That is irrelevant really] All I'm looking for is the load script to combine 4 of these bars to make a recorded bar so I don't have to use 2 datasets (ie by summing
Diab_Hbraw = '<= 7%'
Diab_Hbraw = '> 7% & <= 8%'
Diab_Hbraw = '> 8% & < 10%'
Diab_Hbraw = '>= 10%' )
I don't know how to sum in the load script, particularly when needing to use set values as above.
- Mark as New
- Bookmark
- Subscribe
- Mute
- Subscribe to RSS Feed
- Permalink
- Report Inappropriate Content
Clea,
the script may look like this (first LOAD only to recreate your data sample, the grouping takes place in the second and third LOAD):
Patients:
LOAD Diab_Hbraw, RowNo() as RecID
WHILE iterno() <= Num;
LOAD Dual(Diab_Hbraw,recno()) as Diab_Hbraw,  Num INLINE [
Diab_Hbraw,Num
'<= 7%' ,300
'> 7% & <= 8%',100
'> 8% & < 10%',200
'>= 10%',50
'No HBA1c Recorded',225
];

Group:
LOAD Diab_Hbraw, Diab_Hbraw as Diab_Hbraw_Grouped
Resident Patients
WHERE NOT Exists(Diab_Hbraw_Grouped,Diab_Hbraw);


LOAD Diab_Hbraw, Dual('Recorded',0) as Diab_Hbraw_Grouped
Resident Group
WHERE Diab_Hbraw < 5; // 5 denotes last entry in the list of dual values, all Diab_Hbraw except 'no HBA1c Recorded'
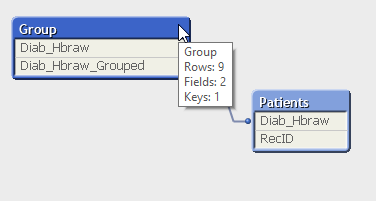
This creates two tables, first is your current fact table with all patient records and the Diab_Hbraw field, the second table is just used to group your Diab_Hbraw values:

| Diab_Hbraw | Diab_Hbraw_Grouped |
|---|---|
| <= 7% | Recorded |
| > 7% & <= 8% | Recorded |
| > 8% & < 10% | Recorded |
| >= 10% | Recorded |
| <= 7% | <= 7% |
| > 7% & <= 8% | > 7% & <= 8% |
| > 8% & < 10% | > 8% & < 10% |
| >= 10% | >= 10% |
| No HBA1c Recorded | No HBA1c Recorded |
Now you can create your charts, using the Diab_Hbraw_Grouped field as dimension and Count(DISTINCT RecID) as expression (resp. Count(DISTINCT RecID) / Count(DISTINCT TOTAL RecID) for the percentage).
![2016-04-03 12_40_22-QlikView x64 - [C__Users_Stefan_Downloads_comm211859.qvw_].png](/legacyfs/online/120338_2016-04-03 12_40_22-QlikView x64 - [C__Users_Stefan_Downloads_comm211859.qvw_].png)
Hope this helps,
Stefan
- Mark as New
- Bookmark
- Subscribe
- Mute
- Subscribe to RSS Feed
- Permalink
- Report Inappropriate Content
Hi Stefan,
Thank you for this. I hadn't considered this alternative due to not knowing about it. Thanks for broadening my knowledge. I ended up playing around with my data before I got your response and ended up adding a field in using plus signs - I had tried the sum function but it wasn't working in the load script. I will have a play with your idea but here is my script in case others want to use it too.
Due to my raw data I have to transpose it and then crosstable it. I just added the extra field in before cross tabling so it would be part of the set.
Diab_Hb_sum:
LOAD
date(Data_Date ,'MMM-YY') as Date,
Place,
[<= 7%]+[> 7% & <= 8%]+[> 8% & < 10%]+[>= 10%] as Recorded,
[<= 7%],
[> 7% & <= 8%],
[> 8% & < 10%],
[>= 10%],
[No HBA1c Recorded] as [No HbA1c]
FROM
Source_Data.xls
(biff, embedded labels, table is HbA1craw$, filters(
Remove(Row, Pos(Top, 3)),
Transpose()
))
;
//Remove row 3 as it has a total in it and is not needed for the set
Diab_Hb_yah:
CrossTable(Diab_group, Diab_group_Pop, 2)
LOAD *
Resident Diab_Hb_sum;
DROP Table Diab_Hb_sum;