Unlock a world of possibilities! Login now and discover the exclusive benefits awaiting you.
- Qlik Community
- :
- All Forums
- :
- QlikView App Dev
- :
- Passing a set of filters in qlikview
- Subscribe to RSS Feed
- Mark Topic as New
- Mark Topic as Read
- Float this Topic for Current User
- Bookmark
- Subscribe
- Mute
- Printer Friendly Page
- Mark as New
- Bookmark
- Subscribe
- Mute
- Subscribe to RSS Feed
- Permalink
- Report Inappropriate Content
Passing a set of filters in qlikview
Hi all ,
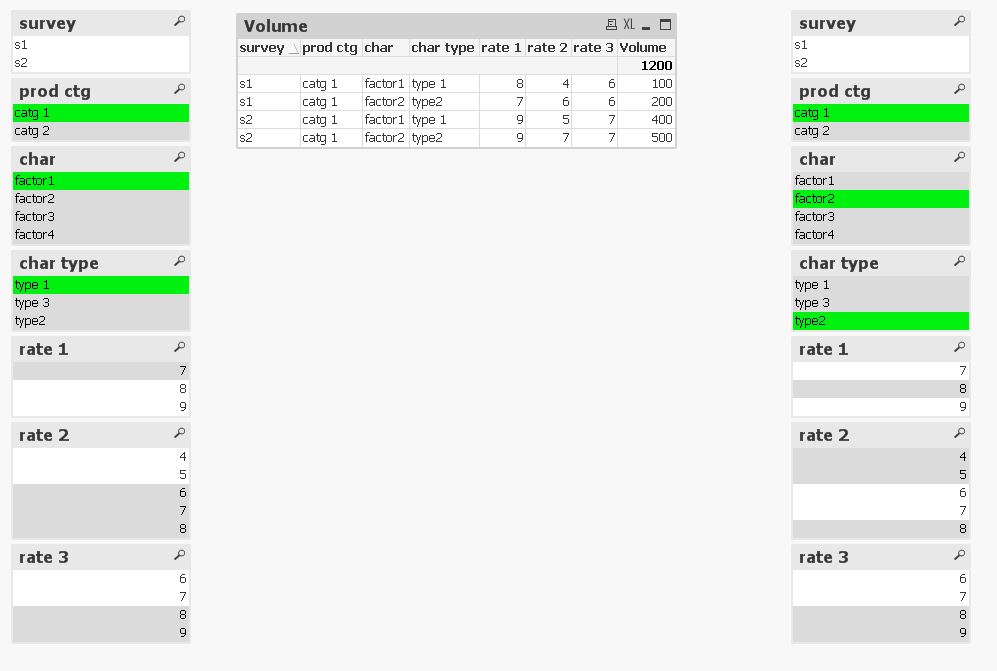
I have this below given requirement to display as a table in the qlikview document with the set of filters passed for filtering the data.
| survey | prod ctg | char | char type | rate 1 | rate 2 | rate 3 | volume |
| s1 | catg 1 | factor1 | type 1 | 8 | 4 | 6 | 100 |
| s1 | catg 1 | factor2 | type2 | 7 | 6 | 6 | 200 |
| s1 | catg 1 | factor3 | type 3 | 9 | 7 | 8 | 300 |
| s2 | catg 1 | factor1 | type 1 | 9 | 5 | 7 | 400 |
| s2 | catg 1 | factor2 | type2 | 9 | 7 | 7 | 500 |
| s2 | catg 1 | factor3 | type 3 | 9 | 8 | 9 | 600 |
| s2 | catg 2 | factor4 | type 1 | 7 | 4 | 7 | 700 |
| s2 | catg 2 | factor2 | type2 | 8 | 6 | 7 | 800 |
| s2 | catg 2 | factor3 | type 3 | 9 | 8 | 9 | 900 |
the filters given on the report are :
1.survey
2.prod ctg
3.char
4. char type
5. range slicer(0-10)
output table displays the following columns
1.survey
2.prod ctg
3.char
4.char type
5.volume
the requirement is that the user must be allowed to pass 6 sets of filter.
set of filters include one from the available 5 filters(survey,prod ctg,char,char type,range slicer value)
OR condition needs to be applied when the filter values are passed.
for example: set1 filters OR set2 filters (output will now diplay the data for both the filters selected in set 1 and set 2 )
as i am new to qlikview , i have no idea how to solve this..
can this be handled by setanalysis ? if not then how can this be handled.
Kinldy help with any supportive expressions.
will be greatfull for any kind of help on this post .
thanks.
- « Previous Replies
- Next Replies »
Accepted Solutions
- Mark as New
- Bookmark
- Subscribe
- Mute
- Subscribe to RSS Feed
- Permalink
- Report Inappropriate Content
Here's a modification of my example that lets you make selections and then add them to the next filter slot. Only filter slots that have selections will be applied to the charts. I have 5 states. I'm rotating through them but you could design the flow any way you want, i.e. add to specific filter etc.
Edit: modified the qvw to use a slider to set the manual index. Much more fun.
-Rob
- Mark as New
- Bookmark
- Subscribe
- Mute
- Subscribe to RSS Feed
- Permalink
- Report Inappropriate Content
You have given long description, but can you also post the final answer you are looking for?
i.e. Apply filter and what could be the output ?
- Mark as New
- Bookmark
- Subscribe
- Mute
- Subscribe to RSS Feed
- Permalink
- Report Inappropriate Content
You mean the table should appear only after selecting all the five filters?
- Mark as New
- Bookmark
- Subscribe
- Mute
- Subscribe to RSS Feed
- Permalink
- Report Inappropriate Content
Hi Varun,
yes the filter should appear only after the 5 filters are selected and each filter is a set of filters.
i.e Set 1 is prod ctg = ctg 1 , char = factor 1 and char type = type 1
after selecting the above set of filters the table should be displayed.
then the filters are cleared or the selections of filters are cleared to allow the user to select the second set of filters , but the result in the table should still be available
so when user selects the second set of filters
Set 2 is prod ctg = ctg 2 , char = factor 4 and char type = type 1
and say apply filter
The result table should have both the results of SET 1 and SET 2
---------------------------------------------------
kindly shower your thoughts on the same.
it would be helpful if you suggest anything possible on this scenario.
Thanks
- Mark as New
- Bookmark
- Subscribe
- Mute
- Subscribe to RSS Feed
- Permalink
- Report Inappropriate Content
Hi Manish ,
the out would be expected in a table calculating the volume of the filters selected.
for example :
Set 1 filter is prod ctg = ctg 1 , char = factor 1 and char type = type 1
after selecting the above set of filters the table should be displayed.
then the filters are cleared or the selections of filters are cleared to allow the user to select the second set of filters , but the result in the table should still be available
so when user selects the second set of filters
Set 2 filter is prod ctg = ctg 2 , char = factor 4 and char type = type 1
and say apply filter
The result table should have both the results of SET 1 and SET 2
please help on how to achieve this.
Thanks
- Mark as New
- Bookmark
- Subscribe
- Mute
- Subscribe to RSS Feed
- Permalink
- Report Inappropriate Content
Provide output in excel file, if possible.
- Mark as New
- Bookmark
- Subscribe
- Mute
- Subscribe to RSS Feed
- Permalink
- Report Inappropriate Content
Hi Manish,
Find the below data and the expected :
| Data available: | |||||||||||
| survey | prod ctg | char | char type | rate 1 | rate 2 | rate 3 | volume | ||||
| s1 | catg 1 | factor1 | type 1 | 8 | 4 | 6 | 100 | ||||
| s1 | catg 1 | factor2 | type2 | 7 | 6 | 6 | 200 | ||||
| s1 | catg 1 | factor3 | type 3 | 9 | 7 | 8 | 300 | ||||
| s2 | catg 1 | factor1 | type 1 | 9 | 5 | 7 | 400 | ||||
| s2 | catg 1 | factor2 | type2 | 9 | 7 | 7 | 500 | ||||
| s2 | catg 1 | factor3 | type 3 | 9 | 8 | 9 | 600 | ||||
| s2 | catg 2 | factor4 | type 1 | 7 | 4 | 7 | 700 | ||||
| s2 | catg 2 | factor2 | type2 | 8 | 6 | 7 | 800 | ||||
| s2 | catg 2 | factor3 | type 3 | 9 | 8 | 9 | 900 | ||||
| set 1 filters : prod ctg = catg 1 , char = factor 1 and char type = type 1 | |||||||||||
| set 2 filters : prod ctg = catg 1 , char = factor 2 and char type = type 2 | |||||||||||
| Output required when Set 1 is applied : | |||||||||||
| survey | prod ctg | char | char type | rate 1 | rate 2 | rate 3 | volume | This table results when the set 1 filters are applied | |||
| s1 | catg 1 | factor1 | type 1 | 8 | 4 | 6 | 100 | ||||
| s2 | catg 1 | factor1 | type 1 | 9 | 5 | 7 | 400 500 | ||||
| Output required when Set 1 and Set 2 is applied : | |||||||||||
| survey | prod ctg | char | char type | rate 1 | rate 2 | rate 3 | volume | This table results when the set 2 filters are applied with the result of Set 1 Filters. | |||
| s1 | catg 1 | factor1 | type 1 | 8 | 4 | 6 | 100 | ||||
| s2 | catg 1 | factor1 | type 1 | 9 | 5 | 7 | 400 | ||||
| s1 | catg 1 | factor2 | type2 | 7 | 6 | 6 | 200 | ||||
| s2 | catg 1 | factor2 | type2 | 9 | 7 | 7 | 500 1200 | ||||
Thanks
- Mark as New
- Bookmark
- Subscribe
- Mute
- Subscribe to RSS Feed
- Permalink
- Report Inappropriate Content
Hi Manish ,
Any Ideas on the mentioned post??
- Mark as New
- Bookmark
- Subscribe
- Mute
- Subscribe to RSS Feed
- Permalink
- Report Inappropriate Content
You can achieve the same using alternate state.
Something like enclosed..
- Mark as New
- Bookmark
- Subscribe
- Mute
- Subscribe to RSS Feed
- Permalink
- Report Inappropriate Content
Hi Manish ,
Thanks for the suggestion , but i am not able to figure out what is enclosed alternate state.
i tried creating state 1 and state 2 for 2 listboxes.. seems like the table should also be assigned some state for the filter to be effected.
please help on how to acheive this.
I also have 5 filters in my case and i cannot be giving the same filters multiple times. so i guess your suggested method may completely satisfy my criteria.
Kindly suggest on the same.
Many Thanks in Advance.
- « Previous Replies
- Next Replies »