Unlock a world of possibilities! Login now and discover the exclusive benefits awaiting you.
- Qlik Community
- :
- All Forums
- :
- QlikView App Dev
- :
- Re: Percentage in chart
- Subscribe to RSS Feed
- Mark Topic as New
- Mark Topic as Read
- Float this Topic for Current User
- Bookmark
- Subscribe
- Mute
- Printer Friendly Page
- Mark as New
- Bookmark
- Subscribe
- Mute
- Subscribe to RSS Feed
- Permalink
- Report Inappropriate Content
Percentage in chart
Hi All,
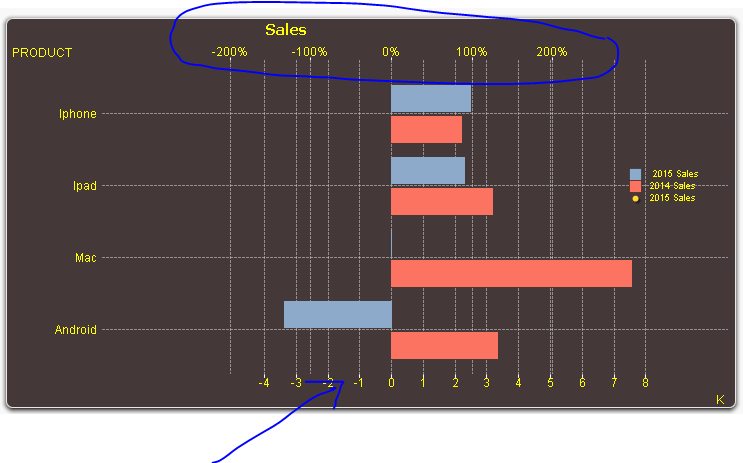
How to show the percentage like -20,-10,0,10,20,....90,100,...in x-axis?
Now it is showing on the top of the chart.
Data:
Load * INLINE [
PRODUCT,2015 Change,2014 Change
Iphone,2514,2240
Ipad,2318,3219
Mac,-1,7589,2509
Android,-3415,3367
];
Percentage Expression: =([2014 Change]-[2015 Change])/[2015 Change]
Thanks in advance.
Accepted Solutions
- Mark as New
- Bookmark
- Subscribe
- Mute
- Subscribe to RSS Feed
- Permalink
- Report Inappropriate Content
- Mark as New
- Bookmark
- Subscribe
- Mute
- Subscribe to RSS Feed
- Permalink
- Report Inappropriate Content
Hi Arjun,
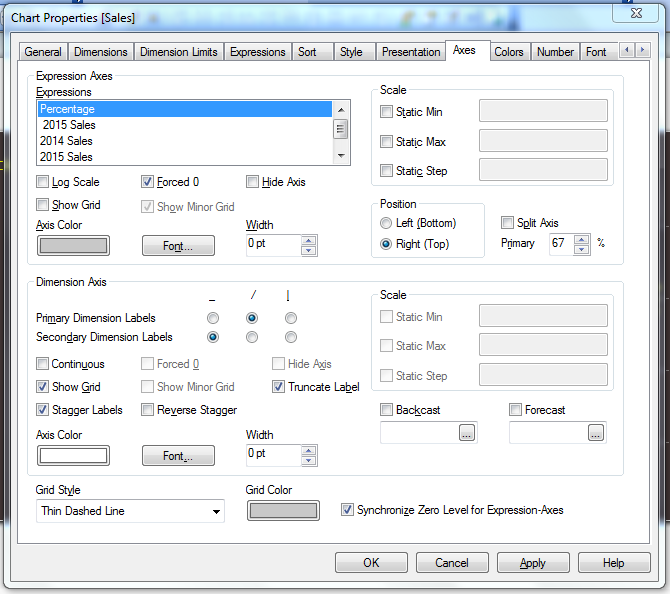
Did you try setting the 'Static min' to -0.1, 'Static max' to 0.1 and 'Static step' to 0.05 in the 'Axes' tab of chart properties?
Regards
- Mark as New
- Bookmark
- Subscribe
- Mute
- Subscribe to RSS Feed
- Permalink
- Report Inappropriate Content
I am new to this. Could you please do help me.
- Mark as New
- Bookmark
- Subscribe
- Mute
- Subscribe to RSS Feed
- Permalink
- Report Inappropriate Content
Hi Arjun,
I am not sure if that could solve your problem but, did you try changing the settings for min and max limits of the axis? Those are in the 'Axes' tab of the chart properties.
Regards
- Mark as New
- Bookmark
- Subscribe
- Mute
- Subscribe to RSS Feed
- Permalink
- Report Inappropriate Content
Hi Arjun,
See the ttachment :
- Mark as New
- Bookmark
- Subscribe
- Mute
- Subscribe to RSS Feed
- Permalink
- Report Inappropriate Content
Hi Arjun,
In Axes Tab,
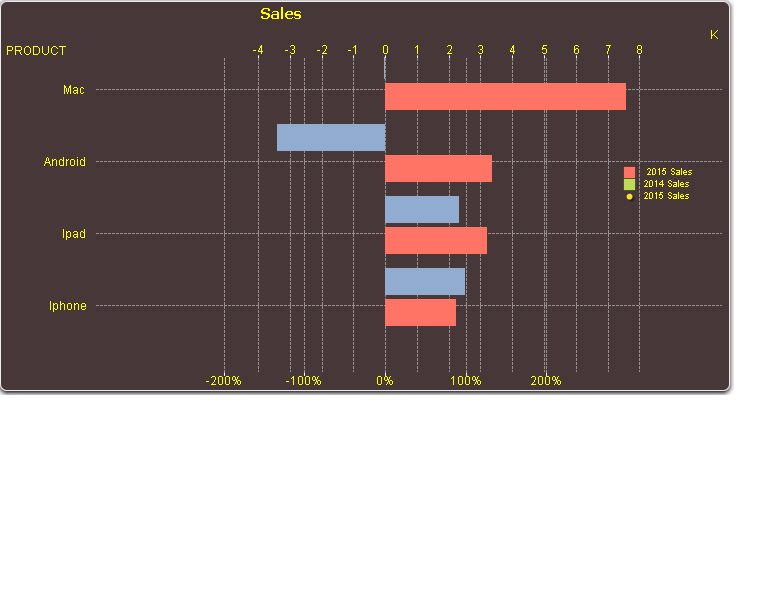
Change position to Left(Bottom) you will get expected output.
Hope it helps!!
- Mark as New
- Bookmark
- Subscribe
- Mute
- Subscribe to RSS Feed
- Permalink
- Report Inappropriate Content
Hi,
What is your expected output?
- Mark as New
- Bookmark
- Subscribe
- Mute
- Subscribe to RSS Feed
- Permalink
- Report Inappropriate Content
Percentage :
=([2014 Change]-[2015 Change])/[2015 Change]
2015 Sales:
sum([2015 Change])
2014 Sales:
sum([2014 Change])
2015 Sales:
sum([2015 Change])
- Mark as New
- Bookmark
- Subscribe
- Mute
- Subscribe to RSS Feed
- Permalink
- Report Inappropriate Content
Hi
Could you please tell me the steps ? I am still confused .
- Mark as New
- Bookmark
- Subscribe
- Mute
- Subscribe to RSS Feed
- Permalink
- Report Inappropriate Content
This is the solution from jsingh71