Unlock a world of possibilities! Login now and discover the exclusive benefits awaiting you.
- Qlik Community
- :
- All Forums
- :
- QlikView App Dev
- :
- Percents of Time Period or Magic of Transformation
- Subscribe to RSS Feed
- Mark Topic as New
- Mark Topic as Read
- Float this Topic for Current User
- Bookmark
- Subscribe
- Mute
- Printer Friendly Page
- Mark as New
- Bookmark
- Subscribe
- Mute
- Subscribe to RSS Feed
- Permalink
- Report Inappropriate Content
Percents of Time Period or Magic of Transformation
Hi friends.
The main purpose is to join 2 tables based on specific rules.
Table 1
| Collection | Group | Period_From | Period_To |
| C1 | G1 | 01.10.2015 | 01.03.2016 |
| C1 | G2 | 01.10.2015 | 01.03.2016 |
| C2 | G1 | 01.01.2015 | 01.03.2015 |
| C2 | G2 | 01.01.2015 | 01.03.2015 |
Table 2
| SubPeriod | Period Share | Rate |
| SP1 | 10% | 3% |
| SP2 | 20% | 10% |
| SP3 | 35% | 20% |
| SP4 | 20% | 10% |
| SP5 | 15% | 15% |
Collection and Group - it's some attributes of product.
Period From and Period To - Range (Life Cycle) of Dates, to which is necessary to join a Rate.
Period Share - it's percent of Range.
Rate - it's some KPI.
For instance for the range 01.10.2015 - 01.03.2016 first SubPeriod will be 01.10.2015-15.10.2015 which equals 10% of range, second SubPeriod will be 16.10.2015-10.11.2015 which equals 20% of range and so on.
It means that i need to divide the period into subperiods according to percent.
Please note that key fields in the join between the two tables aren't present.
What i'm doing:
Step One: Make single date from two dates. Table - Table 1, Fields - Period From and Period To.
tmp_1:
First 1
LOAD
  Collection,
  Group,
  Period_From,
  Period_To
FROM
DataSource.xlsx
(ooxml, embedded labels, table is Sh1)
Where Not IsNull(Collection);

tmp_2:
LOAD
  Collection,
  Group,
  Date(Period_From+IterNo()-1) as [Date of Period],
  Period_From,
  Period_To
Resident tmp_1
While Date(Period_From+IterNo()-1)<=Period_To
Order by
     Collection,
     Group;

DROP Table tmp_1;
As the result we've got the next table:
| Collection | Group | Date of Period | Period_From | Period_To |
| C1 | G1 | 01.10.2015 | 01.10.2015 | 15.10.2015 |
| C1 | G1 | 02.10.2015 | 01.10.2015 | 15.10.2015 |
| C1 | G1 | 03.10.2015 | 01.10.2015 | 15.10.2015 |
| C1 | G1 | 04.10.2015 | 01.10.2015 | 15.10.2015 |
| C1 | G1 | 05.10.2015 | 01.10.2015 | 15.10.2015 |
| C1 | G1 | 06.10.2015 | 01.10.2015 | 15.10.2015 |
| C1 | G1 | 07.10.2015 | 01.10.2015 | 15.10.2015 |
| C1 | G1 | 08.10.2015 | 01.10.2015 | 15.10.2015 |
| C1 | G1 | 09.10.2015 | 01.10.2015 | 15.10.2015 |
| C1 | G1 | 10.10.2015 | 01.10.2015 | 15.10.2015 |
| C1 | G1 | 11.10.2015 | 01.10.2015 | 15.10.2015 |
| C1 | G1 | 12.10.2015 | 01.10.2015 | 15.10.2015 |
| C1 | G1 | 13.10.2015 | 01.10.2015 | 15.10.2015 |
| C1 | G1 | 14.10.2015 | 01.10.2015 | 15.10.2015 |
| C1 | G1 | 15.10.2015 | 01.10.2015 | 15.10.2015 |
and so on...
Step Two: Omg...How to Join ? Any Ideas?
First life cycle (range) have got 152 days. We have the field Period From.
May be i should use cycle "For Next" for each row of Table 1 to join Table 2 ?
May be something like:
SubPeriod From = 0% * {152} + Num(01.10.2015)
SubPeriod Till = 10% * {152} + Num(01.10.2015).
???
Final table should looks like:
| Collection | Group | Date of Period | SubPeriod | Period Share | SubPeriod Date From | SubPeriod Date To | Rate | Rate by Day |
| C1 | G1 | 01.10.2015 | SP1 | 10% | 01.10.2015 | 15.10.2015 | 3% | 0,002 |
| C1 | G1 | 02.10.2015 | SP1 | 10% | 01.10.2015 | 15.10.2015 | 3% | 0,002 |
| C1 | G1 | 03.10.2015 | SP1 | 10% | 01.10.2015 | 15.10.2015 | 3% | 0,002 |
| C1 | G1 | 04.10.2015 | SP1 | 10% | 01.10.2015 | 15.10.2015 | 3% | 0,002 |
| C1 | G1 | 05.10.2015 | SP1 | 10% | 01.10.2015 | 15.10.2015 | 3% | 0,002 |
| C1 | G1 | 06.10.2015 | SP1 | 10% | 01.10.2015 | 15.10.2015 | 3% | 0,002 |
| C1 | G1 | 07.10.2015 | SP1 | 10% | 01.10.2015 | 15.10.2015 | 3% | 0,002 |
| C1 | G1 | 08.10.2015 | SP1 | 10% | 01.10.2015 | 15.10.2015 | 3% | 0,002 |
| C1 | G1 | 09.10.2015 | SP1 | 10% | 01.10.2015 | 15.10.2015 | 3% | 0,002 |
| C1 | G1 | 10.10.2015 | SP1 | 10% | 01.10.2015 | 15.10.2015 | 3% | 0,002 |
| C1 | G1 | 11.10.2015 | SP1 | 10% | 01.10.2015 | 15.10.2015 | 3% | 0,002 |
| C1 | G1 | 12.10.2015 | SP1 | 10% | 01.10.2015 | 15.10.2015 | 3% | 0,002 |
| C1 | G1 | 13.10.2015 | SP1 | 10% | 01.10.2015 | 15.10.2015 | 3% | 0,002 |
| C1 | G1 | 14.10.2015 | SP1 | 10% | 01.10.2015 | 15.10.2015 | 3% | 0,002 |
| C1 | G1 | 15.10.2015 | SP1 | 10% | 01.10.2015 | 15.10.2015 | 3% | 0,002 |
| C1 | G1 | 16.10.2015 | SP2 | 20% | 16.10.2015 | 10.11.2015 | 10% | 0,003846154 |
| C1 | G1 | 17.10.2015 | SP2 | 20% | 16.10.2015 | 10.11.2015 | 10% | 0,003846154 |
| C1 | G1 | 18.10.2015 | SP2 | 20% | 16.10.2015 | 10.11.2015 | 10% | 0,003846154 |
| C1 | G1 | 19.10.2015 | SP2 | 20% | 16.10.2015 | 10.11.2015 | 10% | 0,003846154 |
| C1 | G1 | 20.10.2015 | SP2 | 20% | 16.10.2015 | 10.11.2015 | 10% | 0,003846154 |
| C1 | G1 | 21.10.2015 | SP2 | 20% | 16.10.2015 | 10.11.2015 | 10% | 0,003846154 |
| C1 | G1 | 22.10.2015 | SP2 | 20% | 16.10.2015 | 10.11.2015 | 10% | 0,003846154 |
| C1 | G1 | 23.10.2015 | SP2 | 20% | 16.10.2015 | 10.11.2015 | 10% | 0,003846154 |
| C1 | G1 | 24.10.2015 | SP2 | 20% | 16.10.2015 | 10.11.2015 | 10% | 0,003846154 |
| C1 | G1 | 25.10.2015 | SP2 | 20% | 16.10.2015 | 10.11.2015 | 10% | 0,003846154 |
| C1 | G1 | 26.10.2015 | SP2 | 20% | 16.10.2015 | 10.11.2015 | 10% | 0,003846154 |
| C1 | G1 | 27.10.2015 | SP2 | 20% | 16.10.2015 | 10.11.2015 | 10% | 0,003846154 |
| C1 | G1 | 28.10.2015 | SP2 | 20% | 16.10.2015 | 10.11.2015 | 10% | 0,003846154 |
| C1 | G1 | 29.10.2015 | SP2 | 20% | 16.10.2015 | 10.11.2015 | 10% | 0,003846154 |
| C1 | G1 | 30.10.2015 | SP2 | 20% | 16.10.2015 | 10.11.2015 | 10% | 0,003846154 |
| C1 | G1 | 31.10.2015 | SP2 | 20% | 16.10.2015 | 10.11.2015 | 10% | 0,003846154 |
| C1 | G1 | 01.11.2015 | SP2 | 20% | 16.10.2015 | 10.11.2015 | 10% | 0,003846154 |
| C1 | G1 | 02.11.2015 | SP2 | 20% | 16.10.2015 | 10.11.2015 | 10% | 0,003846154 |
| C1 | G1 | 03.11.2015 | SP2 | 20% | 16.10.2015 | 10.11.2015 | 10% | 0,003846154 |
| C1 | G1 | 04.11.2015 | SP2 | 20% | 16.10.2015 | 10.11.2015 | 10% | 0,003846154 |
| C1 | G1 | 05.11.2015 | SP2 | 20% | 16.10.2015 | 10.11.2015 | 10% | 0,003846154 |
| C1 | G1 | 06.11.2015 | SP2 | 20% | 16.10.2015 | 10.11.2015 | 10% | 0,003846154 |
| C1 | G1 | 07.11.2015 | SP2 | 20% | 16.10.2015 | 10.11.2015 | 10% | 0,003846154 |
| C1 | G1 | 08.11.2015 | SP2 | 20% | 16.10.2015 | 10.11.2015 | 10% | 0,003846154 |
| C1 | G1 | 09.11.2015 | SP2 | 20% | 16.10.2015 | 10.11.2015 | 10% | 0,003846154 |
| C1 | G1 | 10.11.2015 | SP2 | 20% | 16.10.2015 | 10.11.2015 | 10% | 0,003846154 |
I hope I clearly explained the essence of the problem.
Friends please help.
Any recommendations, advices, logic, peace of code, scripts, ideas...
Thanks in advance.
P.S.: Data source and peace of script in attachment.
Accepted Solutions
- Mark as New
- Bookmark
- Subscribe
- Mute
- Subscribe to RSS Feed
- Permalink
- Report Inappropriate Content
There was an issue with detecting a change in Collection / Group, I also added a Date rounding.
tmp_1:
First 4
LOAD
  Collection,
  Group,
  autonumber(Collection & Group) as Key,
  Period_From,
  Period_To
FROM
DataSource.xlsx
(ooxml, embedded labels, table is Sh1)
Where Not IsNull(Collection);


JOIN
LOAD
     SubPeriod,
     [Period Share],
     Rate,
     rangesum(peek(Acc),[Period Share]) as Acc

FROM
[DataSource.xlsx]
(ooxml, embedded labels, table is Sh1)
Where Not IsNull(SubPeriod);


SubPeriods:
LOAD *,
  if(Key=Peek(Key), Date(Peek(Period_Sub_To)+1), Period_From) as Period_Sub_From,
  Date(round(rangesum( (Period_To-Period_From)*Acc,Period_From))) as Period_Sub_To
 RESIDENT tmp_1;

drop table tmp_1;
- Mark as New
- Bookmark
- Subscribe
- Mute
- Subscribe to RSS Feed
- Permalink
- Report Inappropriate Content
This will create a join of the sub periods to your table with Collection and Group and create the sub periods.
tmp_1:
First 1
LOAD
Collection,
Group,
Period_From,
Period_To
FROM
DataSource.xlsx
(ooxml, embedded labels, table is Sh1)
Where Not IsNull(Collection);
JOIN
LOAD
SubPeriod,
[Period Share],
Rate,
rangesum(peek(Acc),[Period Share]) as Acc
FROM
[DataSource.xlsx]
(ooxml, embedded labels, table is Sh1)
Where Not IsNull(SubPeriod);
SubPeriods:
LOAD *,
Timestamp(rangesum( (Period_To-Period_From)*Peek(Acc),Period_From)) as Period_Sub_From,
Timestamp(rangesum( (Period_To-Period_From)*Acc,Period_From)) as Period_Sub_To
RESIDENT tmp_1;
drop table tmp_1;
The resulting table looks like
| Collection | Group | Period_From | Period_To | Period_Sub_From | Period_Sub_To | SubPeriod | Period Share | Rate | Acc |
|---|---|---|---|---|---|---|---|---|---|
| C1 | G1 | 01.10.2015 | 01.03.2016 | 01.10.2015 0:00:00 | 16.10.2015 4:48:00 | SP1 | 10% | 3% | 0,1 |
| C1 | G1 | 01.10.2015 | 01.03.2016 | 16.10.2015 4:48:00 | 15.11.2015 14:24:00 | SP2 | 20% | 10% | 0,3 |
| C1 | G1 | 01.10.2015 | 01.03.2016 | 15.11.2015 14:24:00 | 07.01.2016 19:12:00 | SP3 | 35% | 20% | 0,65 |
| C1 | G1 | 01.10.2015 | 01.03.2016 | 07.01.2016 19:12:00 | 07.02.2016 4:48:00 | SP4 | 20% | 10% | 0,85 |
| C1 | G1 | 01.10.2015 | 01.03.2016 | 07.02.2016 4:48:00 | 01.03.2016 0:00:00 | SP5 | 15% | 15% | 1 |
You'll need to decide how to transform the timestamps to dates (by rounding, floor / ceil etc.) not sure what your business logic is here.
From here, you can proceed with your logic to generate single dates, right?
- Mark as New
- Bookmark
- Subscribe
- Mute
- Subscribe to RSS Feed
- Permalink
- Report Inappropriate Content
There was an issue with detecting a change in Collection / Group, I also added a Date rounding.
tmp_1:
First 4
LOAD
  Collection,
  Group,
  autonumber(Collection & Group) as Key,
  Period_From,
  Period_To
FROM
DataSource.xlsx
(ooxml, embedded labels, table is Sh1)
Where Not IsNull(Collection);


JOIN
LOAD
     SubPeriod,
     [Period Share],
     Rate,
     rangesum(peek(Acc),[Period Share]) as Acc

FROM
[DataSource.xlsx]
(ooxml, embedded labels, table is Sh1)
Where Not IsNull(SubPeriod);


SubPeriods:
LOAD *,
  if(Key=Peek(Key), Date(Peek(Period_Sub_To)+1), Period_From) as Period_Sub_From,
  Date(round(rangesum( (Period_To-Period_From)*Acc,Period_From))) as Period_Sub_To
 RESIDENT tmp_1;

drop table tmp_1;
- Mark as New
- Bookmark
- Subscribe
- Mute
- Subscribe to RSS Feed
- Permalink
- Report Inappropriate Content
Hi,
another solution could be:
tabInput:
LOAD *, RecNo() as ID1, Period_To-Period_From as PeriodLength FROM [https://community.qlik.com/thread/167242] (html, codepage is 1252, embedded labels, table is @1);
Join
LOAD *, RangeSum([Period Share],Peek(PeriodShareSum)) as PeriodShareSum
FROM [https://community.qlik.com/thread/167242] (html, codepage is 1252, embedded labels, table is @2);
tabResult:
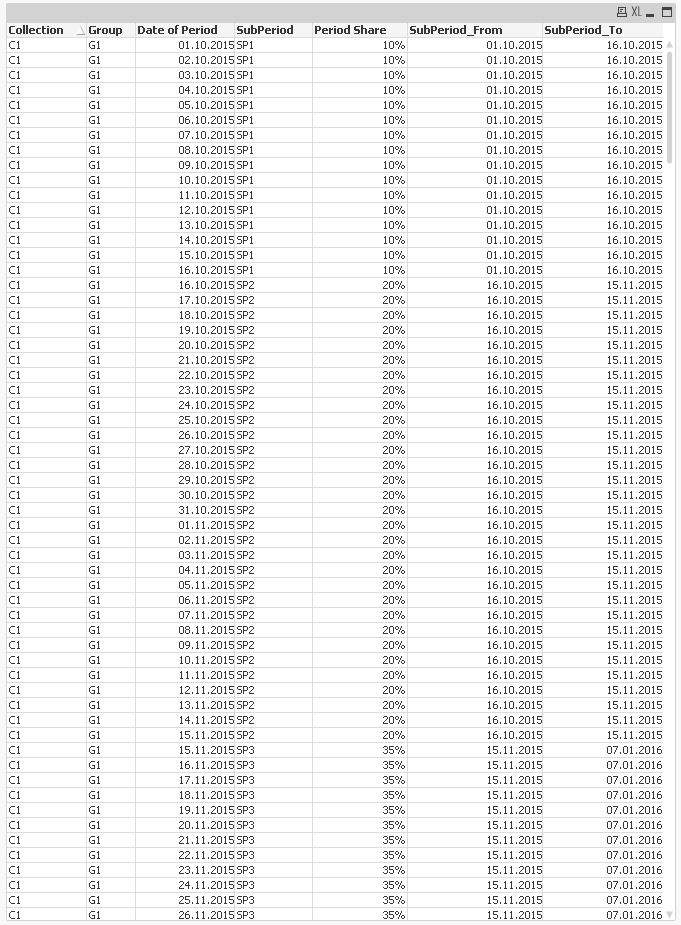
LOAD *,
DayName(SubPeriod_From+IterNo()-1) as [Date of Period]
While SubPeriod_From+IterNo()-1 <= SubPeriod_To;
LOAD Collection,
Group,
SubPeriod,
[Period Share],
DayName(If(ID1=Previous(ID1),Previous(PeriodShareSum)*PeriodLength,0)+Period_From) as SubPeriod_From,
DayName(PeriodShareSum*PeriodLength+Period_From) as SubPeriod_To
Resident tabInput;
DROP Table tabInput;
hope this helps
regards
Marco
- Mark as New
- Bookmark
- Subscribe
- Mute
- Subscribe to RSS Feed
- Permalink
- Report Inappropriate Content
Swuehl, Marko thanks a lot for yours help.
Both solutions are working fine 