Unlock a world of possibilities! Login now and discover the exclusive benefits awaiting you.
- Qlik Community
- :
- All Forums
- :
- QlikView App Dev
- :
- Performance Scorecard help
- Subscribe to RSS Feed
- Mark Topic as New
- Mark Topic as Read
- Float this Topic for Current User
- Bookmark
- Subscribe
- Mute
- Printer Friendly Page
- Mark as New
- Bookmark
- Subscribe
- Mute
- Subscribe to RSS Feed
- Permalink
- Report Inappropriate Content
Performance Scorecard help
Hi All,
I am trying to create a scorecard in QlikView but not getting any success.I have attached a small example QVW with QVD files.
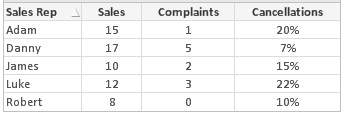
Example Overview :
There are 5 Sales reps and their performance is measured on below KPIs.
- Total Number of Sales
- Total Complaints Received
- Total Cancellations of orders.
NOTE: Each of these KPIs have different targets for each Sales rep and it will change over time. (Like shown above Table)
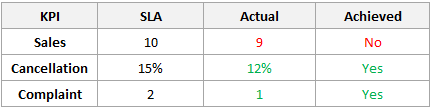
I am trying to achieve following:
To get a table like below and I will have list field of Sales reps.
So when I change the sales rep name from the list then the below table should be updated based on which sales rep is selected.
Accepted Solutions
- Mark as New
- Bookmark
- Subscribe
- Mute
- Subscribe to RSS Feed
- Permalink
- Report Inappropriate Content
See attached example for the easy way out. If you want to do it the hard way then use a synthetic dimension: ValueList() – For those tricky situations
talk is cheap, supply exceeds demand
- Mark as New
- Bookmark
- Subscribe
- Mute
- Subscribe to RSS Feed
- Permalink
- Report Inappropriate Content
You could either have multiple expressions in the one chart with conditional show on the different expressions based on GetSelectedCount(Sales Rep)=1. This might not give you the presentation you want.
So you could have 2 charts with conditional show on one of them for GetSelectedCount(Sales Rep)=1 and the other GetSelectedCount(Sales Rep) = 0 so the bottom KPI chart will show when you select 1 sales rep
- Mark as New
- Bookmark
- Subscribe
- Mute
- Subscribe to RSS Feed
- Permalink
- Report Inappropriate Content
Hi Lokesh Patel
Check one of the possible solution in the attachment.
Is that what you tried to achieve?
- Mark as New
- Bookmark
- Subscribe
- Mute
- Subscribe to RSS Feed
- Permalink
- Report Inappropriate Content
See attached example for the easy way out. If you want to do it the hard way then use a synthetic dimension: ValueList() – For those tricky situations
talk is cheap, supply exceeds demand
- Mark as New
- Bookmark
- Subscribe
- Mute
- Subscribe to RSS Feed
- Permalink
- Report Inappropriate Content
Thank you all for your time I really appreciate it..
I will try to implement this in the actual application.
I have one more question.
What is the best way to get the names of KPI dynamically?
Because in the real scenario there are around 10 KPIs and also not all the KPIs applies to all sales rep.
So if I talk about this example... if Sales Rep 'James' is exempted from Complaints (He can have as many complaints as he wants, because there will be no KPI value agains complaints for him) so the complaints row should not appear when 'James' is selected
is that possible?
- Mark as New
- Bookmark
- Subscribe
- Mute
- Subscribe to RSS Feed
- Permalink
- Report Inappropriate Content
Thank you for your time and efforts Anton.
- Mark as New
- Bookmark
- Subscribe
- Mute
- Subscribe to RSS Feed
- Permalink
- Report Inappropriate Content
Thanks gwassenaar
Your QVW and article link is helpful. However, I have asked one more question regarding this example in below comment.
- Mark as New
- Bookmark
- Subscribe
- Mute
- Subscribe to RSS Feed
- Permalink
- Report Inappropriate Content
Create a table with sales reps and the KPI's that are relevant for them. Then create a really complicated synthetic dimension and equally complicated expressions that generate results for the KPI's that are relevant for the selected sales reps. Oh, and you'll need a table with the KPI's and the expressions to calculate them too.
talk is cheap, supply exceeds demand
- Mark as New
- Bookmark
- Subscribe
- Mute
- Subscribe to RSS Feed
- Permalink
- Report Inappropriate Content
Thanks Gysbert.