Unlock a world of possibilities! Login now and discover the exclusive benefits awaiting you.
- Qlik Community
- :
- All Forums
- :
- QlikView App Dev
- :
- Pie Chart Colours
- Subscribe to RSS Feed
- Mark Topic as New
- Mark Topic as Read
- Float this Topic for Current User
- Bookmark
- Subscribe
- Mute
- Printer Friendly Page
- Mark as New
- Bookmark
- Subscribe
- Mute
- Subscribe to RSS Feed
- Permalink
- Report Inappropriate Content
Pie Chart Colours
Hi,
I have a pie chart that is looking at waiting times. So, simply, bandings of 0-4, 4-8, 8-12, 12+. Colours are set but i would like the 12+ banding section to be green when it's less than 10% of all waiting times and red when more than 10%, how?
- Tags:
- new_to_qlikview
- « Previous Replies
-
- 1
- 2
- Next Replies »
- Mark as New
- Bookmark
- Subscribe
- Mute
- Subscribe to RSS Feed
- Permalink
- Report Inappropriate Content
Can you sample file ?
- Mark as New
- Bookmark
- Subscribe
- Mute
- Subscribe to RSS Feed
- Permalink
- Report Inappropriate Content
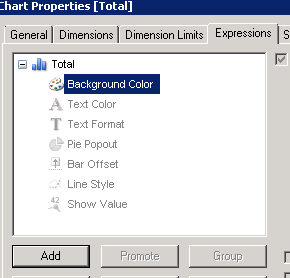
Kevin, The first thing I would do is not use a Pie Chart. Studies have been done that show this chart is difficult to understand. Instead I would us e a stacked bar chart or just a regular bar chart. Then under your expression, you can expand it to show background color, There you can set something like
IF(sum(BANDING)>12,green())
- Mark as New
- Bookmark
- Subscribe
- Mute
- Subscribe to RSS Feed
- Permalink
- Report Inappropriate Content
A sample qvw would help but a possibility would be to use the the background color for your expression - in this ara you would code what you want the colors to be
- Mark as New
- Bookmark
- Subscribe
- Mute
- Subscribe to RSS Feed
- Permalink
- Report Inappropriate Content
File attached
- Mark as New
- Bookmark
- Subscribe
- Mute
- Subscribe to RSS Feed
- Permalink
- Report Inappropriate Content
I do not see any data loaded in the application - can you please reload, include the pie chart with your desired banding and re-attach - thanks
- Mark as New
- Bookmark
- Subscribe
- Mute
- Subscribe to RSS Feed
- Permalink
- Report Inappropriate Content
Sorry my mistake, try again
- Mark as New
- Bookmark
- Subscribe
- Mute
- Subscribe to RSS Feed
- Permalink
- Report Inappropriate Content
Try this. I updated the background color on the expression.
- Mark as New
- Bookmark
- Subscribe
- Mute
- Subscribe to RSS Feed
- Permalink
- Report Inappropriate Content
It looks like there are a total of 25 patients and 17 of them are in the 12+ category. The percent would need to be determined (17/25). which is 68% - If I understand correctly, this section of the pie (or the bar if you switch to a bar char) should be red? If the percent was less than 10% then this section of the pie (or bar) should be green?
- Mark as New
- Bookmark
- Subscribe
- Mute
- Subscribe to RSS Feed
- Permalink
- Report Inappropriate Content
Yes that's correct in what you're saying
- « Previous Replies
-
- 1
- 2
- Next Replies »