Unlock a world of possibilities! Login now and discover the exclusive benefits awaiting you.
- Qlik Community
- :
- All Forums
- :
- QlikView App Dev
- :
- Re: Pie Chart extension object
Options
- Subscribe to RSS Feed
- Mark Topic as New
- Mark Topic as Read
- Float this Topic for Current User
- Bookmark
- Subscribe
- Mute
- Printer Friendly Page
Turn on suggestions
Auto-suggest helps you quickly narrow down your search results by suggesting possible matches as you type.
Showing results for
Anonymous
Not applicable
2016-06-27
05:11 AM
- Mark as New
- Bookmark
- Subscribe
- Mute
- Subscribe to RSS Feed
- Permalink
- Report Inappropriate Content
Pie Chart extension object
Hi Geniuses,
How to create the below kind of Pie Chart, I think it is through extension object but dont know how to create it
1,260 Views
3 Replies
MVP
2016-06-27
05:24 AM
- Mark as New
- Bookmark
- Subscribe
- Mute
- Subscribe to RSS Feed
- Permalink
- Report Inappropriate Content
did you tried with value on the data points option in the Expression tab ??
1,065 Views
Anonymous
Not applicable
2016-06-27
06:32 AM
Author
- Mark as New
- Bookmark
- Subscribe
- Mute
- Subscribe to RSS Feed
- Permalink
- Report Inappropriate Content
If I am using that the numbers will look like below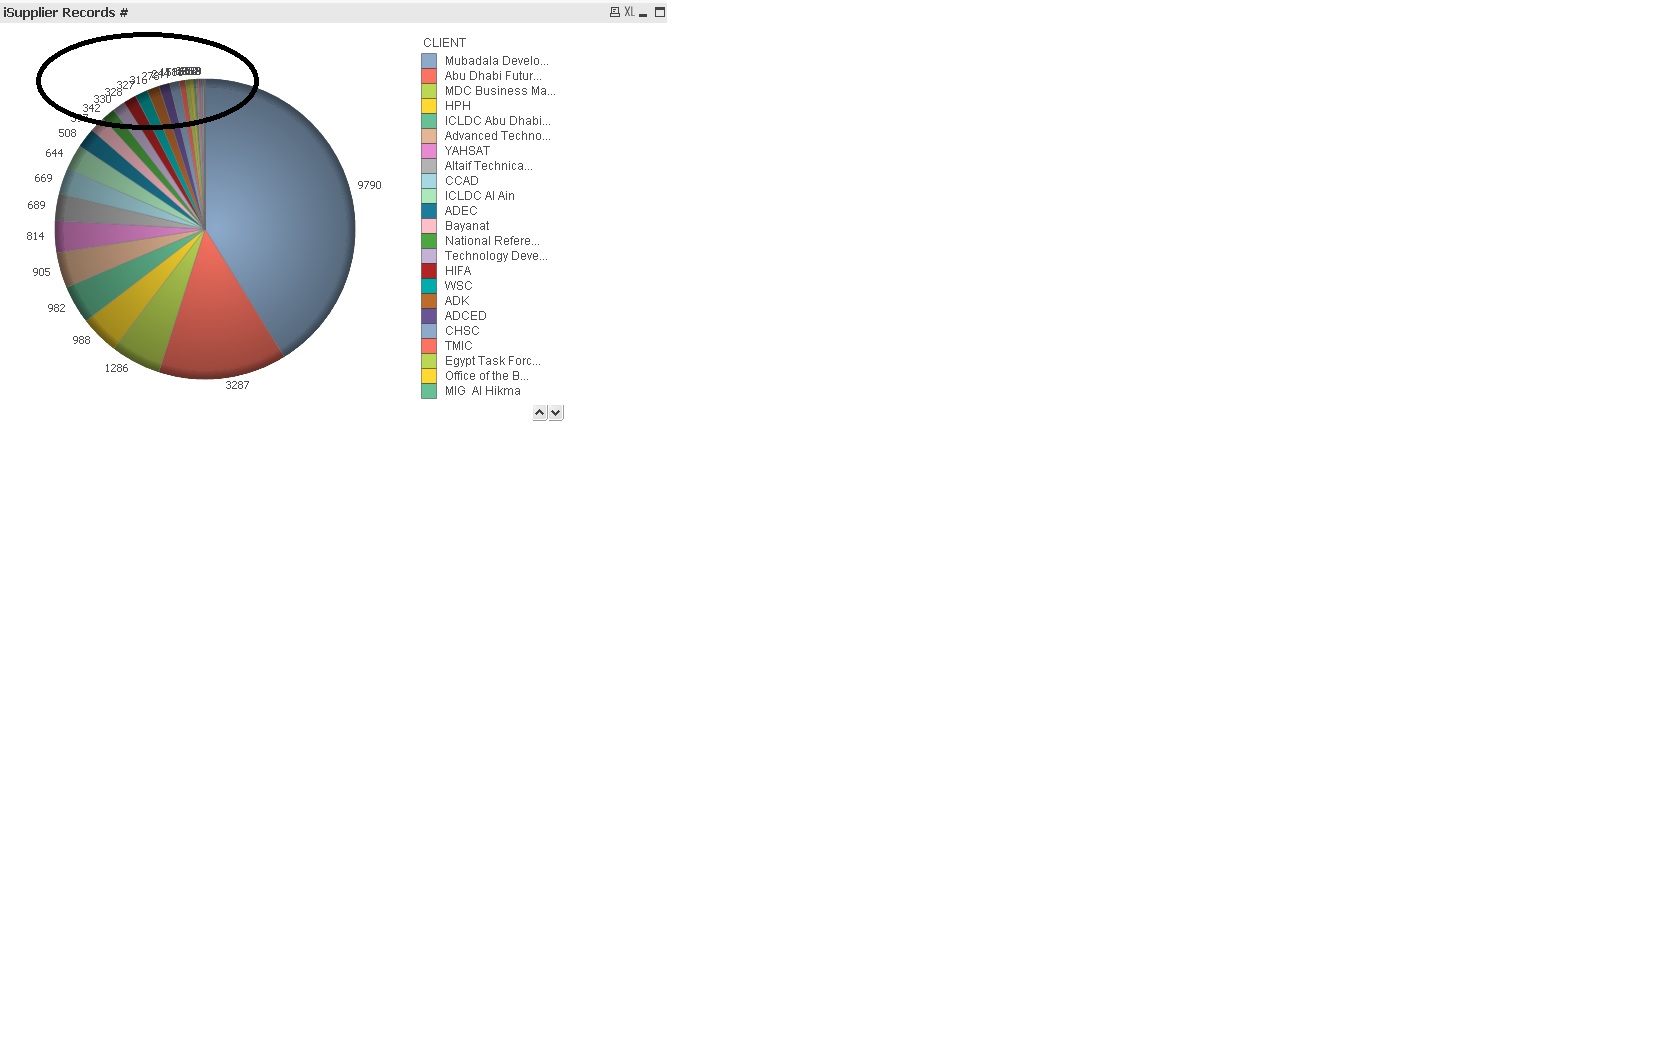
1,065 Views
MVP
2016-06-27
07:05 AM
- Mark as New
- Bookmark
- Subscribe
- Mute
- Subscribe to RSS Feed
- Permalink
- Report Inappropriate Content
Since you have many values in the dimension it appears like that ..why can't you show the numbers with Legend ? that would be a better option rite , to enable the number with Legend got to >Chart Properties > Presentation>Number on Legend ...
1,065 Views