Unlock a world of possibilities! Login now and discover the exclusive benefits awaiting you.
- Qlik Community
- :
- All Forums
- :
- QlikView App Dev
- :
- Re: Pie Chart with 2 Expressions and no Dimension
- Subscribe to RSS Feed
- Mark Topic as New
- Mark Topic as Read
- Float this Topic for Current User
- Bookmark
- Subscribe
- Mute
- Printer Friendly Page
- Mark as New
- Bookmark
- Subscribe
- Mute
- Subscribe to RSS Feed
- Permalink
- Report Inappropriate Content
Pie Chart with 2 Expressions and no Dimension
Hi,
I have data like this that I want to plot on a pie chart :
| Date | Credit | Debit |
|---|---|---|
| 11/1 | 100 | 200 |
| 11/2 | 120 | 180 |
| 11/3 | 180 | 150 |
| 11/4 | 175 | 135 |
| 11/5 | 225 | 300 |
I will have a list box for date and when a particular date is selected, I want the pie chart to show 2 pies - one for Credit and the other for Debit. I tried creating the pie chart without a dimension and 2 expressions, but it didn't give me the expected result.
Can you please provide a solution for this (ideally without the need to create another table in the script) ?
Thanks.
- Mark as New
- Bookmark
- Subscribe
- Mute
- Subscribe to RSS Feed
- Permalink
- Report Inappropriate Content
Hi mayank,
i guset you must create crosstable before to create 1 field to accomodate field Credit and Debit in 1 field
Please try this formula
Account:
CrossTable(act, value, 1)
LOAD *
FROM
C:\Users\Muhammad\Desktop\Book1.xlsx
(ooxml, embedded labels);
and used dimensions act and date
create this xample formula to the Expression
sum(value)
and the view like this
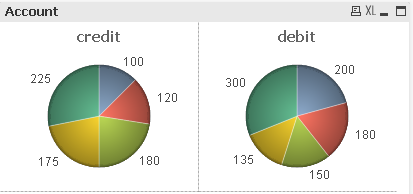
Regards,
Akbar