Unlock a world of possibilities! Login now and discover the exclusive benefits awaiting you.
- Qlik Community
- :
- All Forums
- :
- QlikView App Dev
- :
- Re: Pie Chart within a Pie Chart with 2 Measures a...
- Subscribe to RSS Feed
- Mark Topic as New
- Mark Topic as Read
- Float this Topic for Current User
- Bookmark
- Subscribe
- Mute
- Printer Friendly Page
- Mark as New
- Bookmark
- Subscribe
- Mute
- Subscribe to RSS Feed
- Permalink
- Report Inappropriate Content
Pie Chart within a Pie Chart with 2 Measures and 2 Dimensions
Hi,
I am trying to generate a Pie chart within another Pie Chart.
For example: i have the data as below
| PRIMARY | SECONDARY | Primary Percentage | Secondary Percent |
| A | Apple | 9 | 100 |
| B | Samsung | 37 | 25 |
| B | Nokia | 37 | 50 |
| B | Blackberry | 37 | 25 |
| C | Samsung | 7 | 38 |
| C | Motorola | 7 | 62 |
| D | LG | 3 | 100 |
| E | Sony | 29 | 44 |
| E | LG | 29 | 56 |
I want to display a Drill down Pie chart, Primarily showing the Primary details - > Percentage
Later, on click of any Primary slice ( C ), i want to show the secondary details (Samsung,Motorola -> with Secondary Percentage) for that selected Primary slice.
I am trying to implement this, but am facing issues.
Can anyone please help me on this. 
Thanks in Advance.
Best,
Santosh Kumari
Accepted Solutions
- Mark as New
- Bookmark
- Subscribe
- Mute
- Subscribe to RSS Feed
- Permalink
- Report Inappropriate Content
Create a drill down group and add the fields PRIMARY and SECONDARY to the group. Use the group as dimension in your pie chart. Use this expression if(GetCurrentField(G1)='PRIMARY', [Primary Percentage],[Secondary Percent]). Change G1 to the name of your group. See attached example.
talk is cheap, supply exceeds demand
- Mark as New
- Bookmark
- Subscribe
- Mute
- Subscribe to RSS Feed
- Permalink
- Report Inappropriate Content
| PRIMARY | SECONDARY | Primary Percentage | Secondary Percent |
| A | Apple | 9 | 100 |
| B | Samsung | 37 | 25 |
| B | Nokia | 37 | 50 |
| B | Blackberry | 37 | 25 |
| C | Samsung | 7 | 38 |
| C | Motorola | 7 | 62 |
| D | LG | 3 | 100 |
| E | Sony | 29 | 44 |
| E | LG | 29 | 56 |
- Mark as New
- Bookmark
- Subscribe
- Mute
- Subscribe to RSS Feed
- Permalink
- Report Inappropriate Content
Hello Santosh,
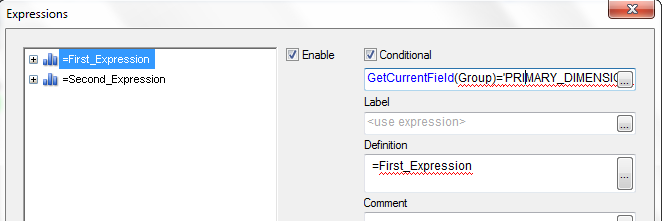
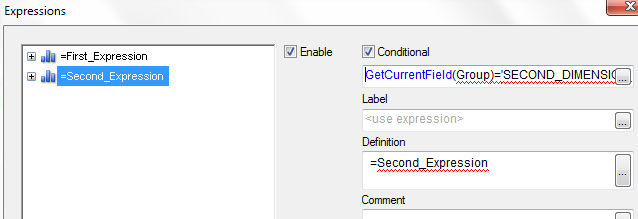
You need to use the conditionnal expression and the function GetCurrentField() in order to know what is the current field selected in the group.
Amand Dupretz
- Mark as New
- Bookmark
- Subscribe
- Mute
- Subscribe to RSS Feed
- Permalink
- Report Inappropriate Content
Create a drill down group and add the fields PRIMARY and SECONDARY to the group. Use the group as dimension in your pie chart. Use this expression if(GetCurrentField(G1)='PRIMARY', [Primary Percentage],[Secondary Percent]). Change G1 to the name of your group. See attached example.
talk is cheap, supply exceeds demand
- Mark as New
- Bookmark
- Subscribe
- Mute
- Subscribe to RSS Feed
- Permalink
- Report Inappropriate Content
This is very much helpful Wassenaar.
Thank you for posting the sample.
Best Regards,
Sai Krishna