Unlock a world of possibilities! Login now and discover the exclusive benefits awaiting you.
- Qlik Community
- :
- All Forums
- :
- QlikView App Dev
- :
- Pie chart with Months
Options
- Subscribe to RSS Feed
- Mark Topic as New
- Mark Topic as Read
- Float this Topic for Current User
- Bookmark
- Subscribe
- Mute
- Printer Friendly Page
Turn on suggestions
Auto-suggest helps you quickly narrow down your search results by suggesting possible matches as you type.
Showing results for
Not applicable
2014-12-08
06:10 AM
- Mark as New
- Bookmark
- Subscribe
- Mute
- Subscribe to RSS Feed
- Permalink
- Report Inappropriate Content
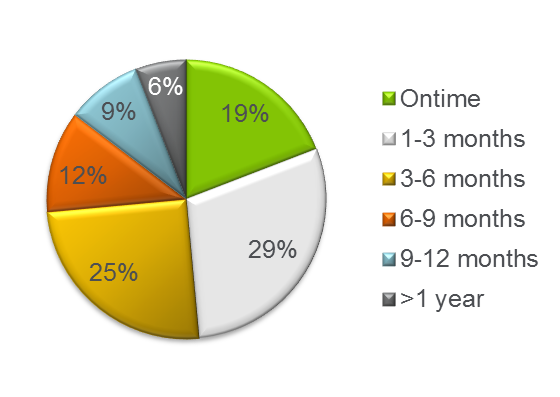
Pie chart with Months
I want to create a pie chart based on months. what type of dimensions to take and what would be the expression?
Thanks in Advance.
- Tags:
- pie-chart
373 Views
2 Replies
Master III
2014-12-08
06:14 AM
- Mark as New
- Bookmark
- Subscribe
- Mute
- Subscribe to RSS Feed
- Permalink
- Report Inappropriate Content
Dimension is Months and expression is what you want show(i.e. delay in shipment ).
291 Views
Former Employee
2014-12-08
06:23 AM
- Mark as New
- Bookmark
- Subscribe
- Mute
- Subscribe to RSS Feed
- Permalink
- Report Inappropriate Content
You need to create a field "Delay" with the values you show in your graph; e.g. 'Ontime', '1-3 months', etc. Use this as dimension. Your expression should be Count(distinct ShipmentID) or something similar.
HIC
291 Views