Unlock a world of possibilities! Login now and discover the exclusive benefits awaiting you.
- Qlik Community
- :
- All Forums
- :
- QlikView App Dev
- :
- Pivot Table Functionality
- Subscribe to RSS Feed
- Mark Topic as New
- Mark Topic as Read
- Float this Topic for Current User
- Bookmark
- Subscribe
- Mute
- Printer Friendly Page
- Mark as New
- Bookmark
- Subscribe
- Mute
- Subscribe to RSS Feed
- Permalink
- Report Inappropriate Content
Pivot Table Functionality
Hello everyone
I want to know weather below thing is possible
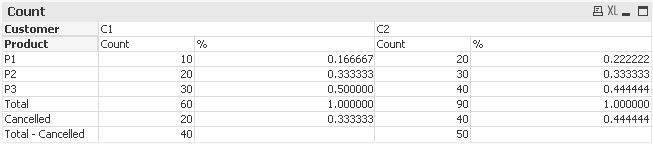
| Customer | c1 | c2 | ||
| count | % | count | % | |
| Product | ||||
| P1 | 10 | 0.166667 | 20 | 0.222222 |
| P2 | 20 | 0.333333 | 30 | 0.333333 |
| P3 | 30 | 0.5 | 40 | 0.444444 |
| Total | 60 | 1 | 90 | 1 |
| Cancelled | 20 | 0.333333 | 40 | 0.444444 |
| total -cancelled | 40 | 50 | ||
Database column are Product, Customer, Orders, cancelled Order
our dimensiona re: Product and Customer
expression is 1. count = Sum of sales
2. % = sum(sales)/sum(TOTAL<cutomer>)Sales
so now I have to add cancelled and (total-cancelled) in below
How can we do it in pivot table and what is the option to implement same layout.
TIA
- « Previous Replies
-
- 1
- 2
- Next Replies »
Accepted Solutions
- Mark as New
- Bookmark
- Subscribe
- Mute
- Subscribe to RSS Feed
- Permalink
- Report Inappropriate Content
This?

Script:
Table:
LOAD Product,
Cutomer,
Orders,
Cancelled
FROM
[https://community.qlik.com/thread/227909]
(html, codepage is 1252, embedded labels, table is @3);
Dim:
LOAD * Inline [
Dim
1
2
3
4
];
Pivot Table
Dimensions:
=Pick(Dim, Product, 'Total', 'Cancelled', 'Total - Cancelled')
Customer
Expressions:
=Pick(Dim,
Sum(Orders),
Sum(Orders),
Sum(Cancelled),
Sum(Orders) - Sum(Cancelled))
Pick(Dim,
Sum(Orders)/Sum(TOTAL <Cutomer> Orders),
Sum(Orders)/Sum(TOTAL <Cutomer> Orders),
Sum(Cancelled)/Sum(TOTAL <Cutomer> Orders),
(Sum(Orders) - Sum(Cancelled))/Sum(TOTAL <Cutomer> Orders))
Sorting the 1st Dimension by a sorting expression: Dim
- Mark as New
- Bookmark
- Subscribe
- Mute
- Subscribe to RSS Feed
- Permalink
- Report Inappropriate Content
just Drag and Drop your Customer Dimension over the Expressions, that's all you need to do.
when you drag the Dimension, you will see a Blue line that shows you how the dimension will be placed for guidance
If a post helps to resolve your issue, please accept it as a Solution.
- Mark as New
- Bookmark
- Subscribe
- Mute
- Subscribe to RSS Feed
- Permalink
- Report Inappropriate Content
You might be able to get this through using Synthetic dimensions or using an Island table in your pivot table. Would you be able to provide the raw data behind this so that we can show you how this might be done?
- Mark as New
- Bookmark
- Subscribe
- Mute
- Subscribe to RSS Feed
- Permalink
- Report Inappropriate Content
Thanks for instant reply..
I did same for customer, But my issue is cancelled should come down after total
it is coming as below
| Customer | c1 | c2 | ||||
| count | % | Cancelled | count | % | Cancelled | |
| Product | ||||||
| P1 | 10 | 0.166667 | 5 | 20 | 0.222222 | 10 |
| P2 | 20 | 0.333333 | 5 | 30 | 0.333333 | 10 |
| P3 | 30 | 0.5 | 10 | 40 | 0.444444 | 10 |
| Total | 60 | 1 | 90 | 1 | ||
- Mark as New
- Bookmark
- Subscribe
- Mute
- Subscribe to RSS Feed
- Permalink
- Report Inappropriate Content
Thanks Sunny, Really no idea about what u have mentioned. Please guide below is my sample data
| Product | Cutomer | Orders | Cancelled |
| P1 | C1 | 10 | 5 |
| P2 | C1 | 20 | 5 |
| P3 | C1 | 30 | 10 |
| P1 | C2 | 20 | 10 |
| P2 | C2 | 30 | 20 |
| P3 | C2 | 40 | 10 |
- Mark as New
- Bookmark
- Subscribe
- Mute
- Subscribe to RSS Feed
- Permalink
- Report Inappropriate Content
This?
Script:
Table:
LOAD Product,
Cutomer,
Orders,
Cancelled
FROM
[https://community.qlik.com/thread/227909]
(html, codepage is 1252, embedded labels, table is @3);
Dim:
LOAD * Inline [
Dim
1
2
3
4
];
Pivot Table
Dimensions:
=Pick(Dim, Product, 'Total', 'Cancelled', 'Total - Cancelled')
Customer
Expressions:
=Pick(Dim,
Sum(Orders),
Sum(Orders),
Sum(Cancelled),
Sum(Orders) - Sum(Cancelled))
Pick(Dim,
Sum(Orders)/Sum(TOTAL <Cutomer> Orders),
Sum(Orders)/Sum(TOTAL <Cutomer> Orders),
Sum(Cancelled)/Sum(TOTAL <Cutomer> Orders),
(Sum(Orders) - Sum(Cancelled))/Sum(TOTAL <Cutomer> Orders))
Sorting the 1st Dimension by a sorting expression: Dim
- Mark as New
- Bookmark
- Subscribe
- Mute
- Subscribe to RSS Feed
- Permalink
- Report Inappropriate Content
Hi avneet,
PFA
- Mark as New
- Bookmark
- Subscribe
- Mute
- Subscribe to RSS Feed
- Permalink
- Report Inappropriate Content
Hi,
I can write this expression n
=
If(Product='P1',1,
If(Product='P2',2,
If(Product='P3',3,
If(Product='Total',4,
If(Product='Cancelled',5,
If(Product='Total - Cancelled',6,))))))
because this will be hardcoding ass my products will get change and are many:(
is there anything else I can dp
- Mark as New
- Bookmark
- Subscribe
- Mute
- Subscribe to RSS Feed
- Permalink
- Report Inappropriate Content
Did you look at the solution I provided?
- Mark as New
- Bookmark
- Subscribe
- Mute
- Subscribe to RSS Feed
- Permalink
- Report Inappropriate Content
Hi,
Thanks but I have one doubt.
Product are coming from ProductMaster table
Customer -->customer Master table
Orders and cancelled are from different table
all these tables are join.
how do I implement your solution
- « Previous Replies
-
- 1
- 2
- Next Replies »